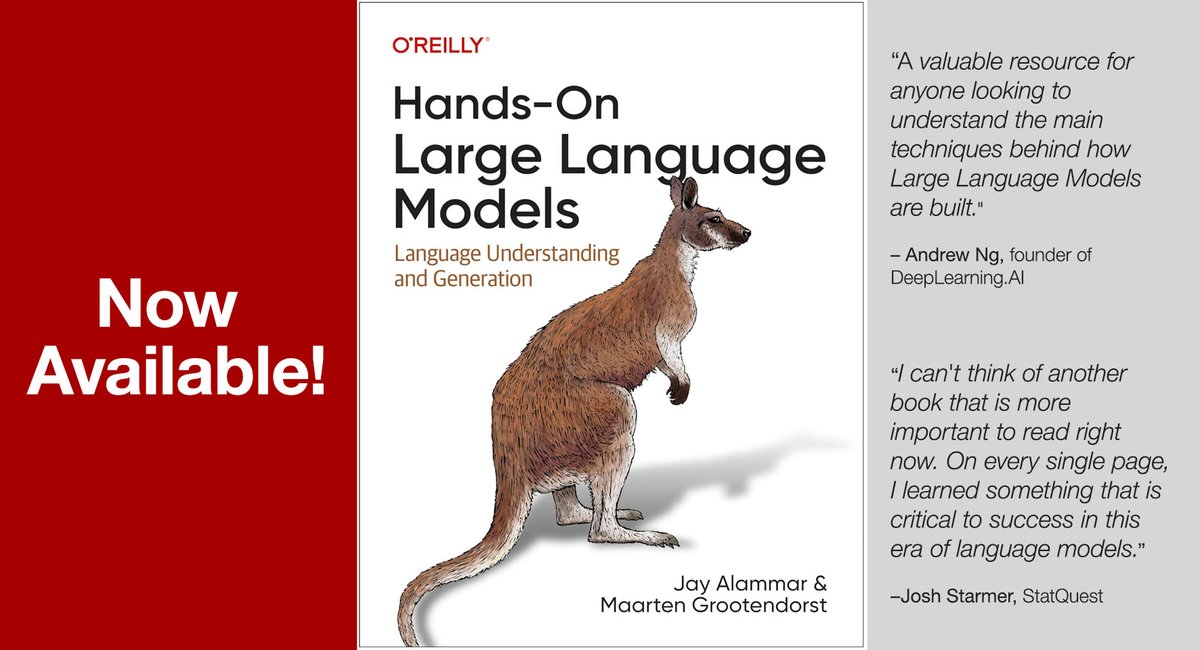
The wait is over! Our book, Hands On Large Language Models is now available!
You can access the digital and Kindle versions today! The print version is in the presses as we speak and can be on their way to you in a couple of weeks.
In this visual introduction to the modern LLM, we have created over 275 original figures that cover some of the most important concepts you'll need to build with LLMs.
Part 1: Understanding Language Models
Part 2: Using Pretrained Language Models
Part 3: Training and Fine-Tuning Language Models.
I'm truly grateful so many people for their support with this project, especially my incredible co-author @MaartenGr.
Hope you enjoy it!
Logging, tracing and metrics are 3 pillars of system observability.
The diagram below shows their definitions and typical architectures.
🔹 Logging
Logging records discrete events in the system. For example, we can record an incoming request or a visit to databases as events. It has the highest volume. ELK (Elastic-Logstash-Kibana) stack is often used to build a log analysis platform. We often define a standardized logging format for different teams to implement, so that we can leverage keywords when searching among massive amounts of logs.
🔹 Tracing
Tracing is usually request-scoped. For example, a user request goes through the API gateway, load balancer, service A, service B, and database, which can be visualized in the tracing systems. This is useful when we are trying to identify the bottlenecks in the system. We use OpenTelemetry to showcase the typical architecture, which unifies the 3 pillars in a single framework.
🔹 Metrics
Metrics are usually aggregatable information from the system. For example, service QPS, API responsiveness, service latency, etc. The raw data is recorded in time-series databases like InfluxDB. Prometheus pulls the data and transforms the data based on pre-defined alerting rules. Then the data is sent to Grafana for display or to the alert manager which then sends out email, SMS, or Slack notifications or alerts.
🔹 Over to you: Which tools have you used for system monitoring?
--
Subscribe to our weekly newsletter to get a Free System Design PDF (158 pages): https://t.co/uc5M7CdXXC
For my new followers:
"Mathematics for machine learning" (CUP, 2020).
🎉Free PDF from https://t.co/mbzGgyoAVP
😊A must-read masterpiece, nicely structured and richly color-illustrated!
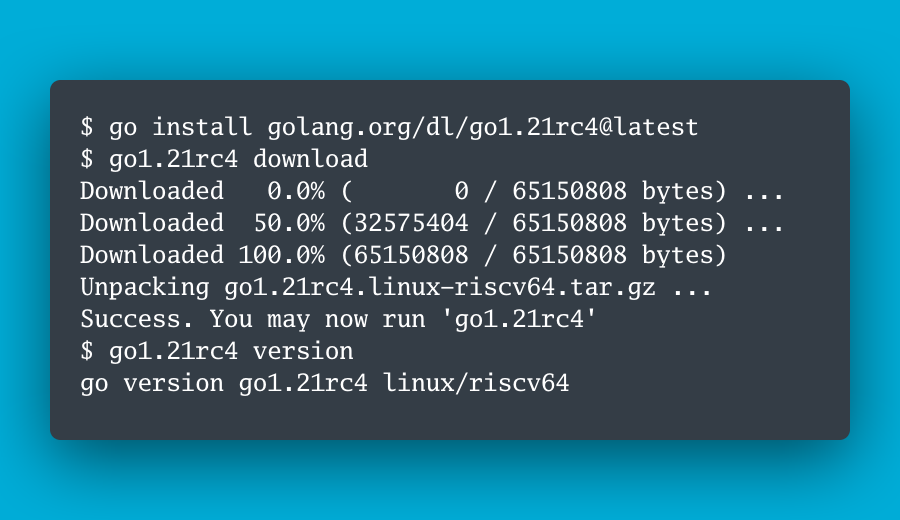
🎉 Go 1.21 Release Candidate 4 is released!
🏃♂️ Run it in dev! Run it in prod! File bugs! https://t.co/Ul1xGhvlkf
🔈 Announcement: https://t.co/uq5bQRnLke
⬇️ Download: https://t.co/QjlTz6zgBZ
#golang
🎉 Go 1.20.6 and 1.19.11 are released!
🔐 Security: Includes security fixes for CVE-2023-29406 and Go issue https://t.co/TvnTCb3lMm
📢 Announcement: https://t.co/6ahFqq7ifS
📦 Download: https://t.co/OmPG7Q663K
#golang
🎊 Go 1.20 Release Candidate 1 is released!
🏃♂️ Run it in dev! Run it in prod! File bugs! https://t.co/Ul1xGhvlkf
📣 Announcement: https://t.co/9zC7AEG4ny
📦 Download: https://t.co/rTk1iN8RNz
#golang
🥳 Go 1.19.4 and 1.18.9 are released!
🔏 Security: Includes security fixes for net/http (CVE-2022-41717, CVE-2022-41720) and os (CVE-2022-41720).
📢 Announcement: https://t.co/cFuWsY1bOo
📦 Download: https://t.co/JkrAPmPlqj
#golang
Happy birthday to me!
My codebase is ten years old, as of today: https://t.co/049QjNCSyn
Today, the PromCon 2022 EU videos were released: https://t.co/02TwkWfsMm
Finally, you should follow me on Mastodon: https://t.co/B8Lfp5yk9m