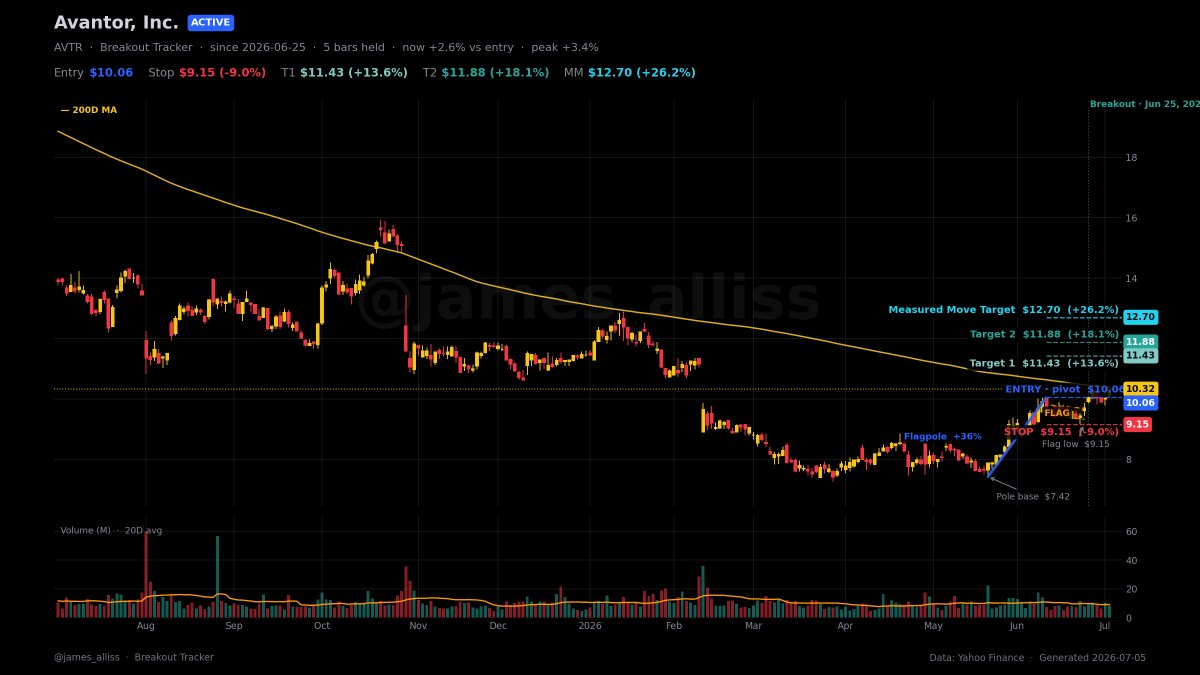
$AVTR - A global life sciences tools company that supplies mission critical products, materials, and services for the biotechnology, pharmaceutical, and healthcare industries.
I like this bullish flag as price attempts to breakout.
The 200 Day MA is just above which may slow this down initially, but if I'm right, price should bash through this resistance.
My full trade plan is in the attached image.
You're responsible for your own trading decisions.
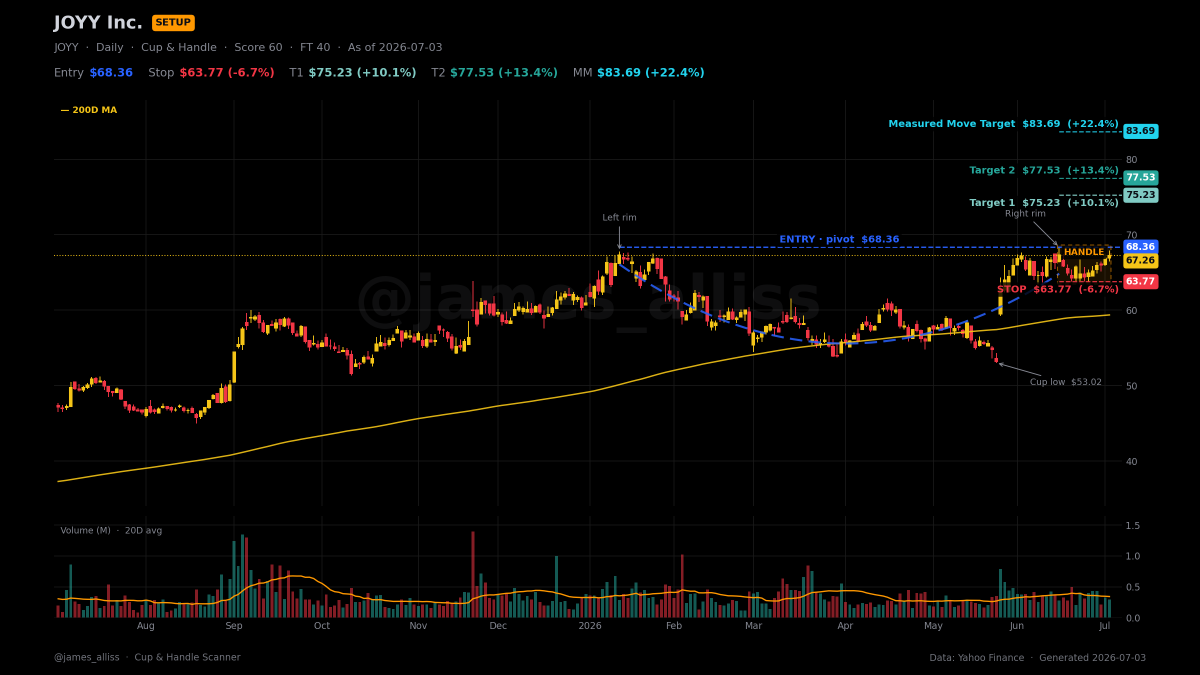
$JOYY - It's worth keeping an eye on this potential Cup and Handle breakout opportunity. Look for a break above $68.36.
My full trade plan is attached.
You're responsible for your own trading decisions.
$BLFS - I've already mentioned this stock. I really believe that it's about to rally based on this price action.
My trade plan is attached with a clear entry, two price targets and stop loss.
If I'm wrong, my risk is around 12% with a minimum reward of 20%.
You're responsible for your own trading decisions.
https://t.co/80iF7LXJmL
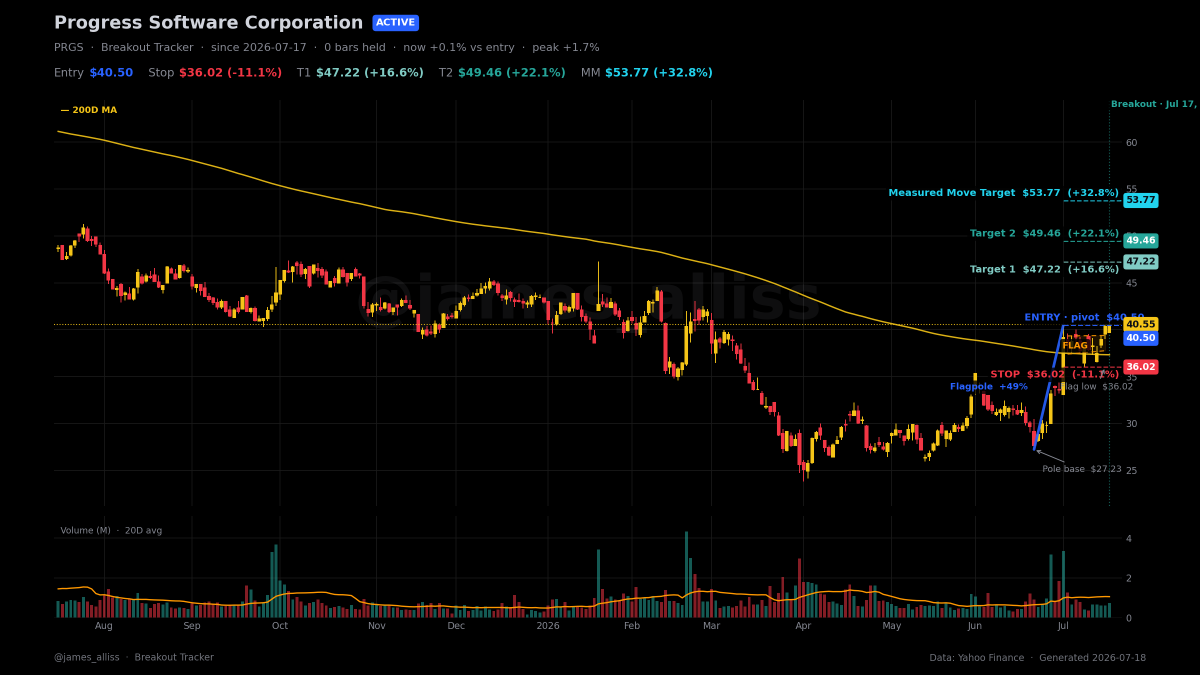
$PRGS - I thought I should mention this stock to you because price is King. and this stock is showing a Bullish Flag pattern.
According to my calculations, a break of $40.50 confirms the buy signal.
I'd like to try and get in at $40 or lower.
My full trade plan is attached.
You're responsible for all of your trading decisions.
$PRGS - I thought I should mention this stock to you because price is King. and this stock is showing a Bullish Flag pattern.
According to my calculations, a break of $40.50 confirms the buy signal.
I'd like to try and get in at $40 or lower.
My full trade plan is attached.
You're responsible for all of your trading decisions.
@TheRonnieVShow Fundamentals being this much stronger at the same price is the case for patience, not for chasing it. What caught my eye was Friday's reversal candle on huge volume right at $70. If that holds, it's a different story. Posted the plan: https://t.co/0ngu6LcjjH
$NFLX – Netflix, Inc. A fantastic trading opportunity with minimal risk and unlimited reward.
This $70 level has history. Look back at the weekly chart and price has reacted hard here twice before – the 2021/22 top and the 2024 retest. In 2026 it's back in play for a third time. We also see the 200 week moving average here.
Earnings dropped price straight through this level on Friday July 17, but by the close a strong bullish reversal candle had formed on a huge volume spike. That kind of volume on a reversal at a level with this much history usually points to institutional buying, not retail.
My Trade Plan:
I'd like to see price clear the high of Friday's candle before doing anything. If that happens, I'll be looking to get in, with my stop at $64.50 – a deliberate buffer below Friday's candle low of $65.08, not the exact low itself.
If $70 fails to hold this time, the level is broken and this just becomes another retest inside a longer downtrend.
You're responsible for your own trading decisions.
@DudeWhoInvests Quality label aside, $70 is a level with real history - it marked the top in 2021/22 and got retested in 2024. Friday's reversal candle on huge volume is the first real sign buyers showed up there again. My full read: https://t.co/0ngu6LcjjH
$NFLX – Netflix, Inc. A fantastic trading opportunity with minimal risk and unlimited reward.
This $70 level has history. Look back at the weekly chart and price has reacted hard here twice before – the 2021/22 top and the 2024 retest. In 2026 it's back in play for a third time. We also see the 200 week moving average here.
Earnings dropped price straight through this level on Friday July 17, but by the close a strong bullish reversal candle had formed on a huge volume spike. That kind of volume on a reversal at a level with this much history usually points to institutional buying, not retail.
My Trade Plan:
I'd like to see price clear the high of Friday's candle before doing anything. If that happens, I'll be looking to get in, with my stop at $64.50 – a deliberate buffer below Friday's candle low of $65.08, not the exact low itself.
If $70 fails to hold this time, the level is broken and this just becomes another retest inside a longer downtrend.
You're responsible for your own trading decisions.
@Barchart Extremes like that usually resolve one of two ways - capitulation or a reversal on volume. Friday's candle at $70 gapped straight through then reversed hard on the heaviest print in months. Worth watching if that holds. Wrote up the level here: https://t.co/0ngu6LcjjH
$NFLX – Netflix, Inc. A fantastic trading opportunity with minimal risk and unlimited reward.
This $70 level has history. Look back at the weekly chart and price has reacted hard here twice before – the 2021/22 top and the 2024 retest. In 2026 it's back in play for a third time. We also see the 200 week moving average here.
Earnings dropped price straight through this level on Friday July 17, but by the close a strong bullish reversal candle had formed on a huge volume spike. That kind of volume on a reversal at a level with this much history usually points to institutional buying, not retail.
My Trade Plan:
I'd like to see price clear the high of Friday's candle before doing anything. If that happens, I'll be looking to get in, with my stop at $64.50 – a deliberate buffer below Friday's candle low of $65.08, not the exact low itself.
If $70 fails to hold this time, the level is broken and this just becomes another retest inside a longer downtrend.
You're responsible for your own trading decisions.
$NFLX – Netflix, Inc. A fantastic trading opportunity with minimal risk and unlimited reward.
This $70 level has history. Look back at the weekly chart and price has reacted hard here twice before – the 2021/22 top and the 2024 retest. In 2026 it's back in play for a third time. We also see the 200 week moving average here.
Earnings dropped price straight through this level on Friday July 17, but by the close a strong bullish reversal candle had formed on a huge volume spike. That kind of volume on a reversal at a level with this much history usually points to institutional buying, not retail.
My Trade Plan:
I'd like to see price clear the high of Friday's candle before doing anything. If that happens, I'll be looking to get in, with my stop at $64.50 – a deliberate buffer below Friday's candle low of $65.08, not the exact low itself.
If $70 fails to hold this time, the level is broken and this just becomes another retest inside a longer downtrend.
You're responsible for your own trading decisions.
$RELY - Another stock to consider. It has broken out of a Cup and Handle price pattern on July 15 - price has retraced to give you a better entry.
I've personally got enough open trades to monitor right now, but you may ne interested in taking this long.
Trade plan attached.
You're responsible for your trading decisions.
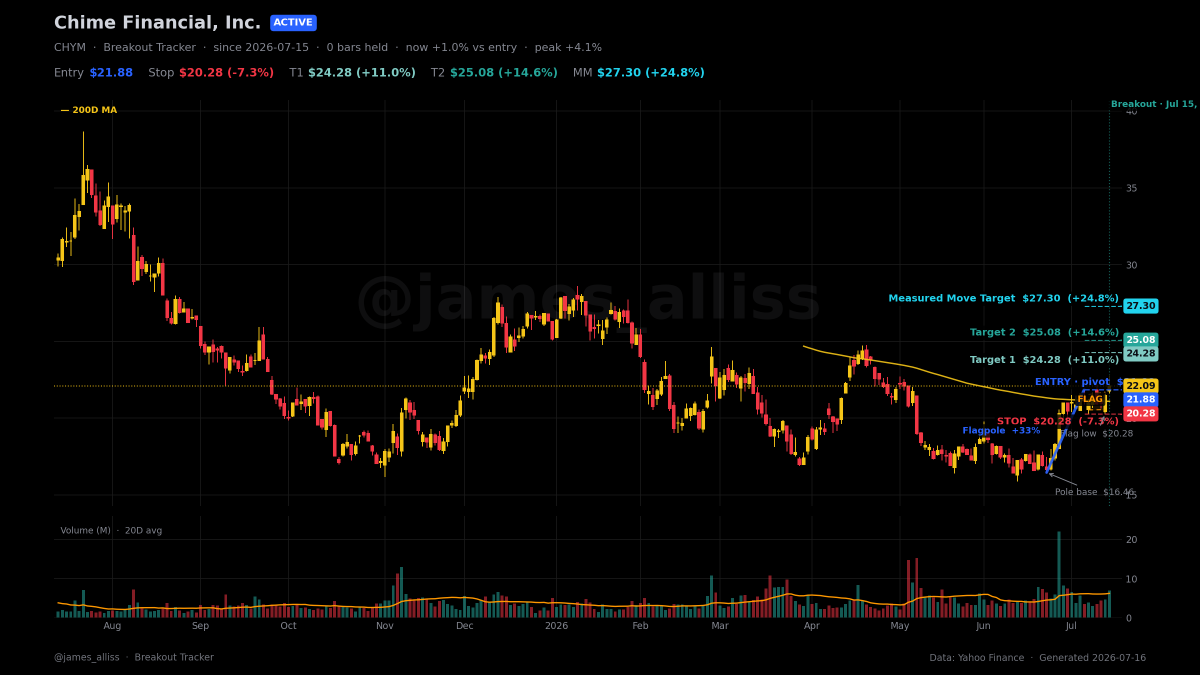
@ProAIMTrader That intraday shakeout is exactly what a flag pullback into support looks like from the inside. I'm long from $21.30 off the July 15th breakout, flag volume had faded to about half the pole. My levels and reasoning here: https://t.co/VT1V6PXeuV
@iTradeCharts Confirmed - that breakout came July 15th off a +33% flagpole, and the flag held above $21.88 all week like you were watching for. I took the long at $21.30. Full technical read here: https://t.co/VT1V6PXeuV
$CHYM - I've got my eye on this. I want to see price hold just below $21.88 before I take the trade.
Here are the technical reasons I like the trade:
- Bull Flag
- Confirmed breakout on 15th July
- Flagpole +33% in 9 bars
- Flag volume receding vs the pole (0.51x)
- Flag retraced 30% of the pole
- Breakout volume 1.5x average
My full trade idea is attached.
You're responsible for all your trading decisions.