I am teaching an introductory course #rstats and data and at one point I felt the need to make data sets to show the relevance of residual analysis and visualization. The result is the {klassets}📦https://t.co/zk6jQtLc8J
Voy a participar en esta iniciativa este fin de semana. Análisis de datos con R, ggplot2 y webscraping con Python. Lo recaudado irá al Jardín Botánico y a la Fundación Manada Animal. Si lo puedes compartir sería genial :). https://t.co/uX92uwbbSV #AcademicTwitter
Excited to announce a new #rstats package, Trelliscope, for interactive exploration of data frames of visualizations: https://t.co/IhHpM5vssM. This reimagines the older trelliscopejs package. It's ready for public evaluation - give it a try and let me know if you have feedback!
Today I published a blog post that will hopefully help all of you who love data vis, but have no idea how to go from there to "actually creating great data vis".
It's full of my learnings from many years.
Find it here: https://t.co/iSuoatmYRw
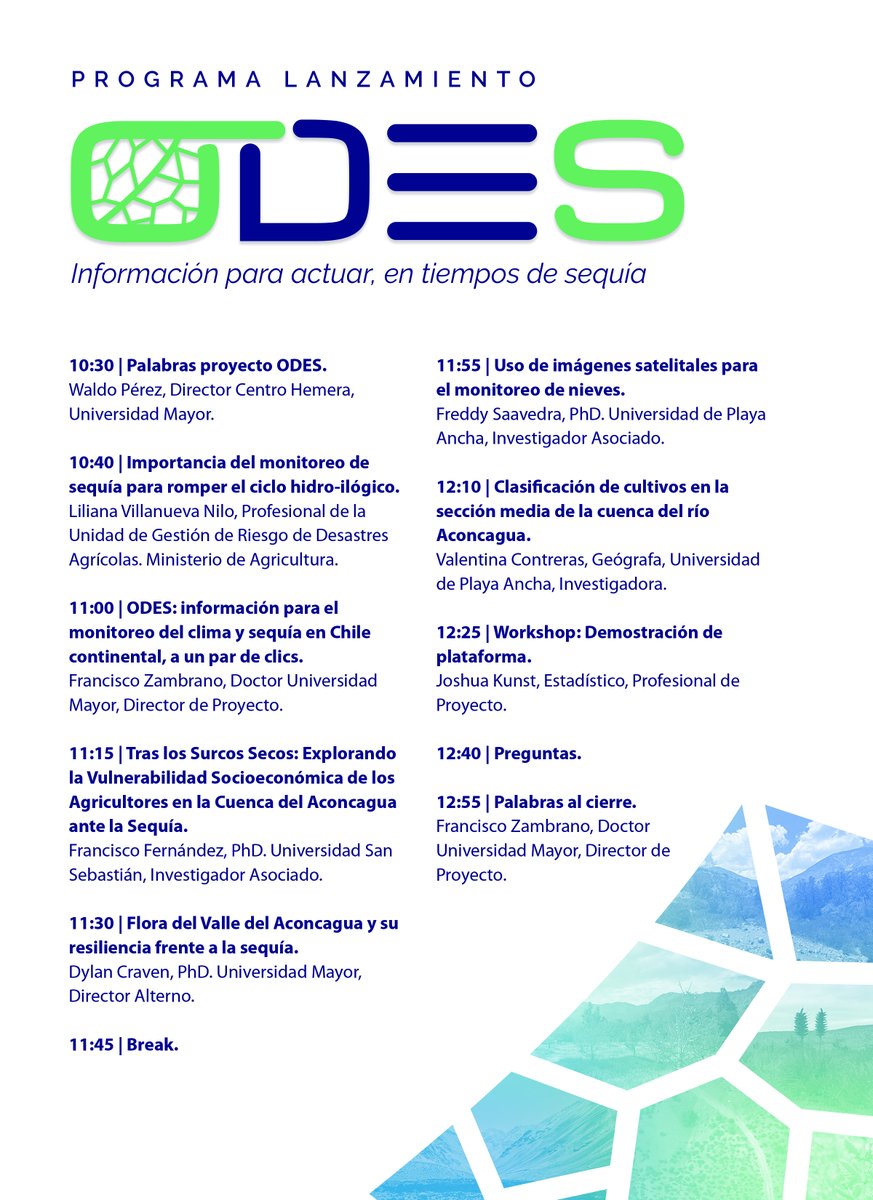
Invitación 📩Lanzamiento Observatorio de Sequía ODES, información para actuar en tiempos de sequía.
02 agosto 2023, 10:30 hrs, Auditorio Campus El Claustro, Universidad Mayor, en Av. Portugal 351, Santiago
Inscripción: https://t.co/y6mQBroxGV
Have you used the {ggparty} + {parttree} combo to visualize and explain how decision trees work? The visualization has its limitations, but it works very well as a first approach #rstats#ggplot2#ggparty#partree https://t.co/Di7e38j65G
🎉 My first big blog post after my parental leave is out! And yes, it's about color; and how smart data vis designers use it to create smart design hierarchies. Plus, I'll show you one of my fav charts (again): https://t.co/FFre0cUVL4
Today I'm updating the plotting docs for webR and it's so nice seeing the recent changes to its HTML canvas graphics device paying off. Letting the web browser handle text rendering is so nice. As far as I can tell everything just does what it's supposed to! #webr#rstats
The video for my recent talk "Shiny: Data-centric web applications in Python" is now available: https://t.co/ObJqGeAvHL
Fun Shiny + ChatGPT demos start at 13:42
#Python#PyData#PyDataSeattle2023
!Ven al lanzamiento del Observatorio de Sequía para la agricultura y Biodiversidad de Chile (ODES)! Es el próximo lunes en San Felipe @CEM_UMayor @InvestigaUMayor
Hello hello! #LatinR2023 in person is coming up in Montevideo and we want to tell you about the modalities of work that you can present. The deadline for receiving proposals is June 16.