Read through the working paper. Strong work. @benjamincowen
The honest limitation flagged in Section 15.3: the reflexivity mechanism is offered as sufficiency, not identification. Price-only data can't distinguish diminishing reflexivity from herding, saturating adoption, or macro-driven amplitude compression.
That's the gap we're building infrastructure to close. Mycelia Signal is currently logging at resolution that didn't exist during the 2013, 2017, or 2021 cycle peaks:
• Multi-venue funding rates (11 exchanges, BTC/ETH/SOL, 60-second resolution)
• Open interest + liquidation flow across venues
• Full IV surfaces, SVI parameters, term structure
• Cross-asset stress (MSSI), liquidity transmission (MSTI), sentiment (MSXI) indices
https://t.co/r1tP0w28cR
By the next BTC cycle peak (~2028-29), there will be a forward record of leverage cost, leverage magnitude, IV-implied tail dynamics, and macro regime — the streams needed to identify, rather than infer, whatever mechanism is producing bHI. Worth watching closely.
Not claiming we can prove or disprove the asymmetry today — data depth is months, not cycles. But the cycle-5 observatory is being built in public.
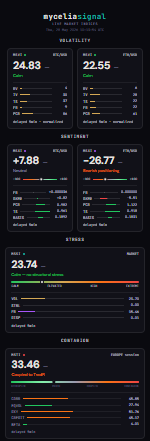
Everyone's looking at the BTC price.
We're looking at the structure underneath it and it's a yawner so far!
$73,400. Down 5%. And:
— Stress index: CALM (23.74/100)
— Sentiment: NEUTRAL (+7.88)
— 10-exchange funding rate: 0.004%
— Stablecoin pegs: zero deviation
— Futures basis: slight backwardation
— Cross-venue dispersion: 0.01%
Every structural indicator says this is healthy repricing. No leverage blowup. No stablecoin wobble. No funding extreme. Exchanges in perfect agreement.
When the price drops and the plumbing stays calm, that's not a crisis. That's a market working. https://t.co/r1tP0w28cR
Everyone's looking at the BTC price.
We're looking at the structure underneath it.
$73,400. Down 5%. And:
— Stress index: CALM (23.74/100)
— Sentiment: NEUTRAL (+7.88)
— 10-exchange funding rate: 0.004%
— Stablecoin pegs: zero deviation
— Futures basis: slight backwardation
— Cross-venue dispersion: 0.01%
Every structural indicator says this is healthy repricing. No leverage blowup. No stablecoin wobble. No funding extreme. Exchanges in perfect agreement.
When the price drops and the plumbing stays calm, that's not a crisis. That's a market working. https://t.co/r1tP0w28cR
I keep seeing the same three words everywhere.
Discord. X. LinkedIn. Telegram. Emails from people I've never met.
The last sentence always starts the same way: "Happy to share..."
And every time I read it, I know exactly what happened. Someone typed a prompt, got a response, and hit paste without reading it.
I know because Claude does it for me too.
So I wrote a tongue in cheek piece, reminding us all that while it's easy to copy and paste, it's better to NOT do it. Put the time in and read/edit before taking the "easy" route. It'll make the world a better place.
https://t.co/fPxjfB3ciE
The funding picture is more nuanced than a single rate suggests.
Here's what we're seeing across our live 10-exchange composite right now:
Hyperliquid: -0.0092%
dYdX: -0.0062%
Bitget: -0.0054%
Bybit: -0.0008%
Deribit: 0.0000%
Bitstamp: +0.0009%
OKX: +0.0024%
Kraken: +0.0034%
Binance: +0.0063%
Coinbase: +0.0112%
Funding isn't uniformly recovering positive — it's split. DeFi venues (Hyperliquid, dYdX) are still negative while CEX venues are positive. Different user bases positioning differently on the same move.
The divergence across venues is 2.0 bps — moderate but widening from 1.5 bps earlier today. When we see DeFi shorts paying while CEX longs are paying, it typically reflects retail dip-buying on CEX while more sophisticated flow stays short on DeFi. Aligns with your dip-buyer trap read.
OI-weighted composite: +0.0012% — pulled positive by Binance ($7.87B, 43% of total OI). Strip out Binance and the weighted rate is near zero or negative. https://t.co/r1tP0w28cR
The data from our live indices backs this up.
Funding just went negative across our 10-exchange composite for the first time since May 17 — shorts are paying longs. That's what a leverage flush looks like in the rate data.
DVOL at 38.1% and falling despite the move down. Options sellers aren't repricing for a breakdown. If this were structural, implied vol would be expanding, not contracting.
CME positioning: leveraged funds 2.7:1 short-to-long. A lot of that needs to unwind eventually. https://t.co/r1tP0w28cR
Our data supports the setup. Some numbers to add to your thesis:
Funding flipped negative across our 10-exchange composite this morning (-0.00033%). First negative print since the May 17 bounce.
CME COT (May 19): leveraged funds 2.7:1 short-to-long — 14,214 shorts vs 5,253 longs, 61.8% of open interest. But they're covering: -1,203 short contracts this week. That's a lot of fuel sitting above if $74,400 holds.
MSXI (our sentiment index): -32.64 BEARISH, down from +20.58 just 48 hours ago. A 53-point swing. The speed of the sentiment deterioration is notable — positioning moved faster than price.
DVOL: 38.1% and actually declining. 5-day trend: 39.95 → 39.79 → 38.45 → 36.72 → 37.14. Options market is pricing this as range-bound, not a structural break. That aligns with your view that we hold and reclaim.
MSSI (stress index): 40.38 ELEVATED — stress building but not at crisis levels where forced liquidation cascades typically start.
The combination of one-sided short positioning on CME, negative funding, and suppressed implied vol is the setup you're describing. Tight invalidation with asymmetric upside if shorts cover. https://t.co/r1tP0w28cR
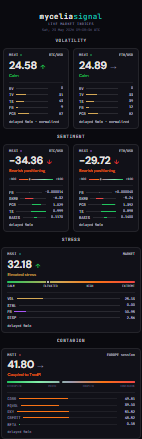
Weekly market state from our live indices + CME COT data (May 23):
BTC $75,909 — down from $77,500 mid-week. Two-week consolidation band holding so far between $75,680 and $78,500.
MSXI: -32.64 BEARISH. Sentiment deteriorated from +20.58 on May 22 to -32.64 today — the sharpest 48-hour swing we've recorded since early May. Funding rates turned negative across our 10-exchange composite. Shorts are now paying longs.
MSSI: 40.38 ELEVATED, up from 28.64 earlier this week. Stress building but not at crisis levels. Cross-venue funding dispersion at 1.9 bps — moderate fragmentation across exchanges.
DVOL: 38.1% — and here's the interesting part. The 5-day trend: 39.95 → 39.79 → 38.45 → 36.72 → 37.14. Implied volatility is actually declining while BTC drops $2,000 and sentiment collapses 53 points. Options sellers are pricing this as range-bound consolidation, not a structural break. The market is saying: "we've seen this move before and it doesn't go anywhere." That consensus holds until it doesn't — and when it breaks, the repricing tends to be abrupt.
COT (May 19): Leveraged funds hold 14,214 shorts vs 5,253 longs on CME — a 2.7:1 short-to-long ratio representing 61.8% of total open interest. For context, a similar short concentration in April 2025 preceded a 70% rally over the following months. However, asset managers reduced longs by 870 contracts this week, and $1B+ flowed out of spot BTC ETFs last week — the largest weekly outflow since January.
The positioning picture is one-sided: negative funding, bearish sentiment, heavy CME shorts, institutional ETF outflows. One-sided positioning creates mechanical vulnerability — shorts covering drives price up, which triggers more covering. Whether that catalyst materializes depends on US-Iran developments and whether the $75,680 support holds.
Data: https://t.co/gFT9Yc9PR0 — 10-exchange funding composite, 4 signed indices, COT positioning. https://t.co/r1tP0w28cR
#BTC #CryptoMarkets #MarketStructure #COT #x402
I spent a large chunk of my Saturday morning adding Coinbase INTX as the 10th exchange in our multi exchange funding rate oracle infrastructure.
The simple task, which I thought would be one cup of coffee: fetch one number (BTC perp funding rate) from 10 sources and compute a weighted composite.
What I actually found during my second cup:
Every exchange uses different field names for the same data. Binance: fundingRate. Deribit: current_funding. Kraken: relativeFundingRate. Coinbase: predicted_funding. Seven names across ten venues.
Settlement periods differ. Binance: 8h. Kraken: 1h. Bitstamp: 4h. Coinbase: 1h. Must normalize before comparing.
Open interest is where it breaks. To weight by capital at stake, you need OI. What the APIs return:
Binance: 105,490 (BTC)
Deribit: 1,023,233,970 (USD)
OKX: 3,401,143 (contracts)
Bybit: 55,792 (BTC)
Coinbase: 198,711,219 (USD)
No units labeled anywhere. Multiply OKX's number by mark price like every other coin-denominated venue and you get $256 billion. Actual OKX BTC OI: $2.57 billion. 100x wrong.
The fix: OKX exposes three OI fields on the same endpoint — oi (contracts), oiCcy (coins), oiUsd (dollars). The correct one for cross-exchange comparison is the third. Not the default. Not in the funding rate docs.
This pattern repeats everywhere APIs are aggregated. Weather: Celsius vs Fahrenheit, knots vs m/s, elevation in meters vs feet. Shipping: decimal degrees vs DMS, speed in knots vs km/h. Finance: volumes in base vs quote vs contracts.
APIs are designed for human developers reading documentation. They are not normalized for machine consumption. AI can scaffold an integration in minutes. It cannot anticipate that oi means contracts on OKX and coins on Binance and USD on Deribit.
AI has compressed the cost of building simple code. But building and maintaining data aggregation across disparate APIs is not a simple process!
https://t.co/zLm2VJLfEB
#x402 #apis #data #fundingrates
lol....I'll tell my wife 😉 Since these indices are really a once per day pulls, the eventual pricing structure is likely in the $1-2 USDC range per query, slightly different than what I mentioned yesterday. The current staleness on the preview is 15 minutes, so use the preview for the time being. I'll change the staleness to 24 hours at some point when I release them formally. Feedback always appreciated.
New Index launching today — the Mycelia Signal Transmission Index-MSTI.
Measures one important question: Is crypto coupled to traditional finance now?
Five components: BTC-equity correlation (30%), equity volatility (25%), DXY momentum (20%), credit spread (15%), and beta amplification (10%). 0-100 scale.
The index is session-aware — so it automatically tracks S&P 500 during US hours, Euro Stoxx 50 during EU, Nikkei 225 during Asia.
What 30 days of data shows prior to today's launch:
MSTI has ranged 29 to 68. Mean: 46. Crypto has spent most of the last month in COUPLED territory — macro moves are transmitting.
The lowest reading (29, MIXED) came during the May 18 overnight session when $BTC was doing its own thing — sentiment hit -46 while equities were closed. Crypto briefly decoupled and traded on internal liquidation dynamics, not macro.
The highest readings (60+) align with US equity sessions where $BTC tracked the S&P tick for tick. When MSTI reads COUPLED, an equity selloff is a crypto selloff. When it reads DECOUPLED, crypto has its own story.
Currently: 43.2 COUPLED (US session). $BTC is tracking equities today.
Free preview: https://t.co/C728kbaasw
Embeddable widget: https://t.co/a7Os66GaJC
#Bitcoin #BTC #Crypto #TradFi #MacroTrading #CryptoTrading #DeFi #x402 #AIAgents #MarketData #QuantTrading
Following up on our NQ conversation. Built two equity indices v1.0 based on what you asked for:
MSVI-EQ — NQ volatility composite (realized vol, VXN, term structure, skew, PCR). Currently reading 47/100, ELEVATED.
MSSI-EQ — cross-asset stress (VIX, credit spreads, yield curve, financial stress, DXY). Currently 25/100, CALM.
Both normalized 0-100 with regime labels. Free previews live now 15 min. delay:
curl https://t.co/E7NQyHGV1K
curl https://t.co/uuu0if80aX
Daily update cycle — pull once per day, get a single score that synthesizes 5 cross-asset signals. I have made them "public", but am not promoting them right now until I do more testing and data analysis. If you have feedback or improvement ideas, let me know.
In case you missed it, we introduced the Mycelia Signal Transmission Index-MSTI yesterday to capture exactly this.
Measures one important question: Is crypto coupled to traditional finance now?
Five components: BTC-equity correlation (30%), equity volatility (25%), DXY momentum (20%), credit spread (15%), and beta amplification (10%). 0-100 scale.
The index is session-aware — so it automatically tracks S&P 500 during US hours, Euro Stoxx 50 during EU, Nikkei 225 during Asia.
What 30 days of data shows prior to today's launch: MSTI has ranged 29 to 68. Mean: 46. Crypto has spent most of the last month in COUPLED territory — macro moves are transmitting. The lowest reading (29, MIXED) came during the May 18 overnight session when $BTC was doing its own thing — sentiment hit -46 while equities were closed. Crypto briefly decoupled and traded on internal liquidation dynamics, not macro. The highest readings (60+) align with US equity sessions where $BTC tracked the S&P tick for tick.
When MSTI reads COUPLED, an equity selloff is a crypto selloff. When it reads DECOUPLED, crypto has its own story. https://t.co/r1tP0w28cR