Let me show you how to call the EXACT TOP this cycle,
It has done before in 2021,
And in 2018,
And will do again this 2024 #crypto bull run.
This metric is something NO ONE talks about,
But it’s proven ACCURATE each cycle.
The best thing about it,
It’s VERY simple,
And only takes 2 minutes to read.
So pay attention and listen,
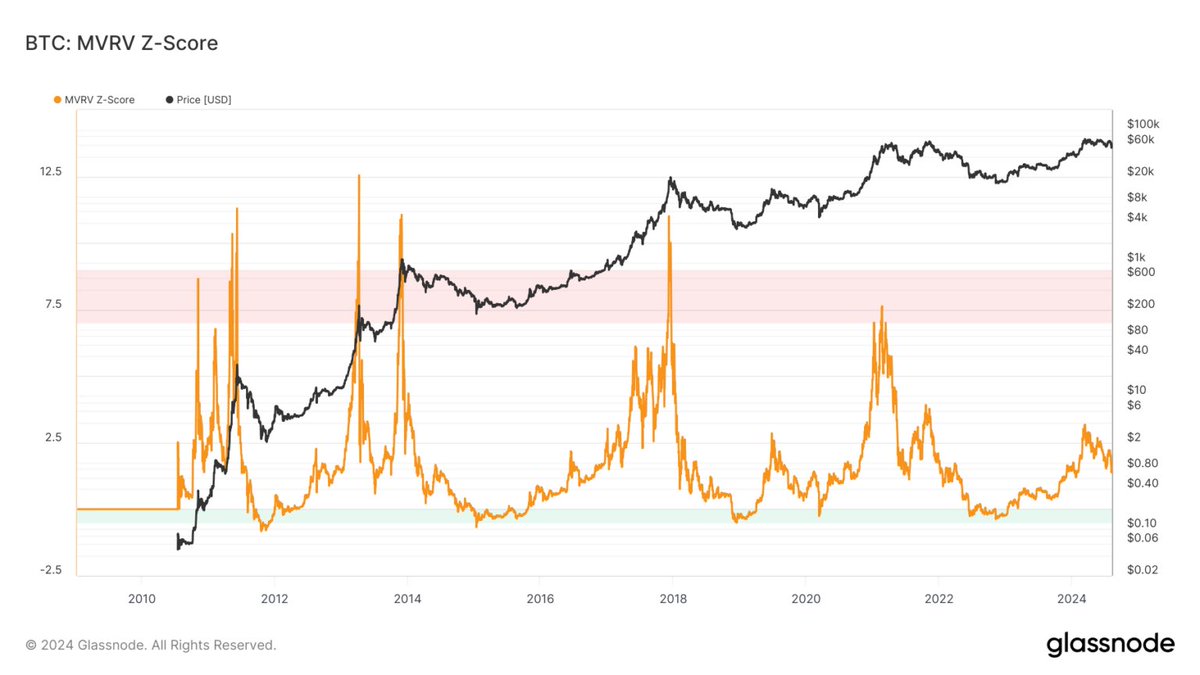
Go to https://t.co/jHeycYJuPw
Check the,
MVRV-Z Score.
If you don't know it, learn it.
It's an on-chain metric that has called the top every time.
When the Z Score hits red, that’s your sign.
Every single cycle it’s been spot on.
And guess what?
Right now,
It is closer to the undervalued levels,
Reflecting a great buying opportunity is near.
It's not a secret,
But most people won’t even bother to look.
When it flashes red, that’s when you sell.
I will alert you all.
No emotions, no guesswork, just a proven strategy.
Simple, right?
Like this tweet as I’ll share more REAL knowledge like this.
I want all my followers to win this cycle.
I will make sure it happens,
No doubt about it.
- BTC D. update -
Many have been constantly fooled by thinking that the famous "altseason" was around the corner, not being able to grasp the reality: the dominance is in a strong uptrend since the start of the 2023.
We never had any significant HTF closures below important levels, not below the 54% or the 52%, with the last that act as key mark to break the bullish structure.
While the SH at 57.03% isn't getting overtaken (yet) the current weekly candle seems to be ready to close above the 3-months cluster (April/May/June), a sign that the macro plan highlighted in June 2023 is perfectly working out and ready to be completed: https://t.co/L518bLiMf0
The 57/58% area remains the one to watch for an HTF reversal, with potential spikes toward 60.10% to fully take out the weekly FVG and therefore creating the necessary environment to push the dominance down.
We're therefore maximum 6% away.
Talking about time horizons if you think about it, it should coincide with the last impulse on the market we expect for the end of the year, and considering that "altseasons" or "period in which altcoins perform really well" (I prefer this explanation) generally last between 1/2 months, with the arrival of BTC to a new ATH, we should have the time to complete the plan.
When the reversal occurs, look for the 43% level to take profits where we have a strong weekly bullish OB which will become even more powerful if you're able to find confluences across major charts like USDT D. + BTC + TOTAL + OTHERS: if they will be at 🔑 levels, you'll know what to do.
ETH/BTC should be another potential confluence to add to your "handbook" since the downtrend has been confirmed on multiple timeframes with the HTF imbalance located at 0.04 that should be the last level for a reversal, matching the above mentioned BTC D. target. 👁️
- USDT D. macro plan -
Pay attention because this might be one of the charts that can save your a*s.
You know how much I use the USDT D. to find powerful confluences to sustain the main PA thesis on Bitcoin and altcoins.
During the past months, we individuated the key areas of 5.30% + 5.80% as they were 2 HTF imbalances created after the parabolic impulse of BTC, which led to a strong correction: https://t.co/QrOUytNs7i
We also had a spike toward 5.90%, very close to the monthly OB located at 6.00%, another important HTF reversal level that, matched with the ones previously mentioned, gave the impulse to BTC to run from 54K to 68K+
The last weekly closure on USDT D occurred below the 4.80%, an historical level that always led to a strong reaction, first sign that we could see further extension on BTC price action, but not before a correction.
The weekly gap plotted before (green rectangle) indeed, acted as perfect support to send the USDT D. back up again, thus boosting the current BTC correction.
So what am I looking for?
Despite the positive closure for market continuation, the USDT D. is still in an uptrend as highlighted from the dotted line and I'm eyeing a potential double bottom (DB) around the 5.80% with a possibility of a spike toward 6.00% (not occurred before)
If this scenario happens, I'm personally ready to deploy the stablecoins that I preserved during these months.
"But bro, what's the TP target down there?"
The last violent impulse we saw to the 3.79% has touched the historical trendline and given the powerful reaction, that likely become a level to closely monitor.
If we see this plan playing out and therefore the USDT D. reaching that mark once again, look for taking profits since we also have the confluence coming from the weekly OB.
Also, when and if we will reach it, monitor the major charts like BTC + TOTAL + OTHERS to find extra confluences -> if they will be at 🔑 resistance/supply levels, you'll know what to do in order to not get rekt.
This chart will help you to avoid a bloody Harakiri while many people will be absorbed by the Infinite Tsukuyomi.👁️
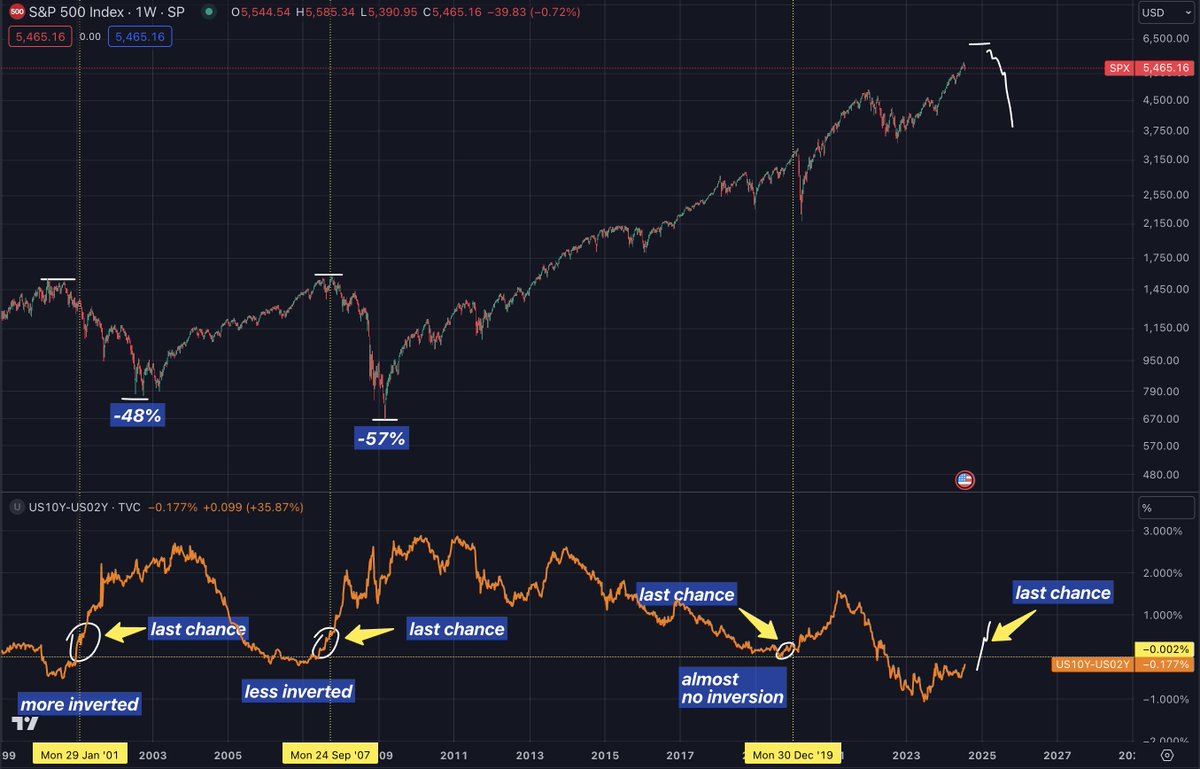
Last chance to get out before recession
Let's talk the yield curve
People who say "this yc is more inverted than last 40 years, so that means drop like 1932 Great Depression bro" did not research enough
In 2002 Dot Com Bubble we had a more inverted yc than 2009 GFC, but SPX price went down only -48% compared to -57% in 2009
So no, it doesn't matter how inverted it is!
Second, the problems come AFTER the first leg up in yield curve, as it gets uninverted and into normality. AFTER!
We are still inverted, so problems are not due tomorrow or next month, but probably 6-12 months from now.
Price may vary, but in this 6-12 month period, market is still hot, price remains higher, as talks about recession stop, economists lower their probability of a recession
30% probability of recession in the US rn. See how consensus on recessions was in the past
1. After pandemic, consensus was 100%. AFTER pandemic 😂 the deed was done, they saw it after it happened
2. In Nov 2021 consensus was like 10%. What happened in July 2022? Technical recession😂 SPX down, BTC down 70%
3. Nov 2022 - consensus 90% for recession - that was the bottom 😂😂😂
Do you understand now?
This year, consensus for recession should keep declining to <10%, that's the top of the market!
We'll revisit later.
These #Bitcoin RSI Bollinger Band % phases are the most accurate I've seen for the true cycle top in price.
It was able to weed out both first April double tops in 2013 and 2021 to only call each final top, something almost no indicator has been able to do. (purple phase 5)
Where does it say we are now?
After the 3rd cross of the red .99 value line in March 2024 we have completed phase 3 which is the second early top. (orange dots)
These phases told us that this move wouldn't firmly move us above ATHs, which happens after phase 4.
We've now reached the same critically low levels of RSI BB% that we've seen at each cycle bottom and even the 2020 black swan. (green arrows)
2 more phases and most of the best price action still left to go this cycle!
#Bitcoin - this is just the beginning.
There are many similarities between the 2016 cycle and the current 2024 cycle.
If you look at the chart, the RSI just returned from the overbought zone while the price moved sideways. We observed a similar pattern in the previous cycle after the Bitcoin halving.
In 2016, the RSI surged from 60 to 90 three times before the price eventually peaked.
The first correction in RSI from the overbought zone after the halving was when bitcoin started going parabolic.
If this pattern repeats, similar to the previous cycle, this is just the beginning..
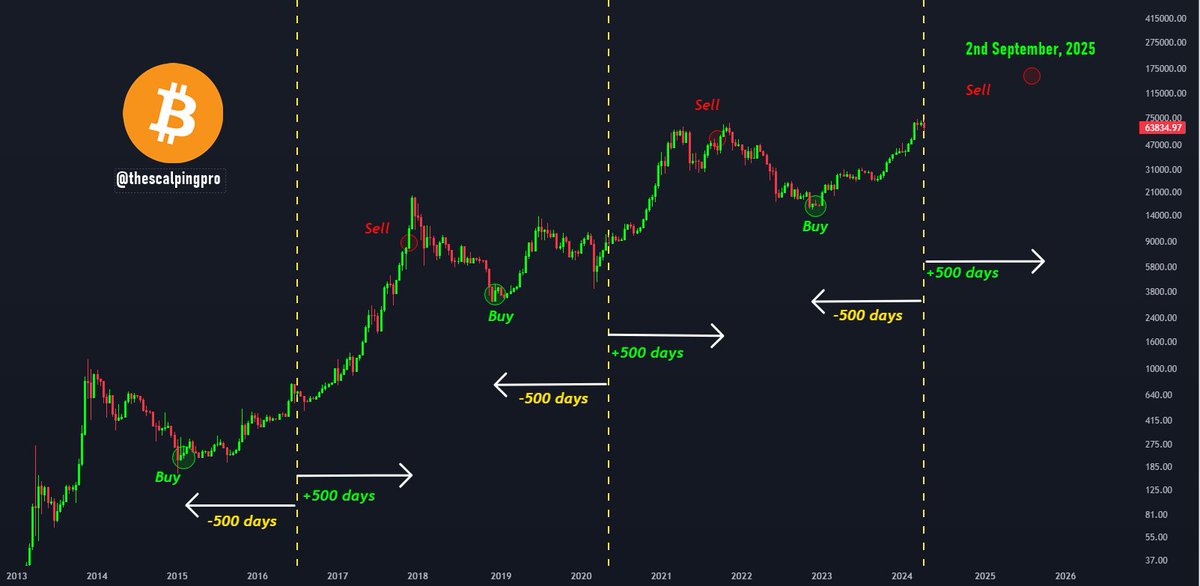
#Bitcoin Halving Strategy 🤝
While no strategy can predict the exact top and bottom, following this simple halving strategy could potentially help you achieve outsized returns.
1) Buy Bitcoin 500 days before the Halving.
2) Hold and do nothing.
3) Sell 500 days after the Halving.
4) Repeat.
This strategy has proven effective in the past. As of today (Halving), 500 days from now falls on September 2nd, 2025.
#Altcoins
Biggest Altcoin-Season since 2017 is loading, but some out there have no patience.
I hope you're not one of them.
Good things take time.🎯
And this will be life changing for those who have patience imo.
#Altcoins market cap is preparing to transition to the final phase that will initiate explosive rallies across alts given the previous cycle data.
#Altseason2024 is about to get interesting folks!
Will be doing a series of posts on $cvx and why it's undervalued from FA standpoint.
But a little TA hopium for those starved for PA.
The general thesis is that liquidity incentives are not in demand until $btc reaches ATH+ ... now that we're there, things start getting interesting.
On the LTF, we've broken and held the trendline break above $4.5. If we start seeing a continuation of wave 3 (yellow) then we will likely push to the $8-12 region soon.
On the higher time frame, I wanted to provide a chart for some context from last cycle and marked off some key ranges for price action as we scale those stairs.
The wave 3 impulse from $5 -> $52 happened in 96d
The wave 5 impulse from $17 -> $64 happened in 28d
When late cycle plays move, they move in a blink of an eye and you'll only have 6-9 months to enjoy those speculative prices.
Fib 1 extension target - $65
Fib 1.618 target - $103
Fib 2.618 target - $165
Where do we end up at the end of the bull?
Who knows, but even if this is off the mark and we're at $50 end of bull, that's a cool 10x from here.
But dream bigger. Last cycle it only had $crv as a proxy.
This cycle $cvx has added a few more protocols. As $crv $prisma $fxs $fxn move 📈 in price, the amount of emissions $cvx 👑 dao controls shifts from millions per month to tens of millions per month.
#Bitcoin🎯
$BTC is only at the beginning of a parabolic curve imo.
With the help of the Keltner Channel this can be shown quite well.
Look at 2015, 2019 and 2020.
Below the base line⚫️,the accumulation takes place. As soon as the price >base line = bull market.
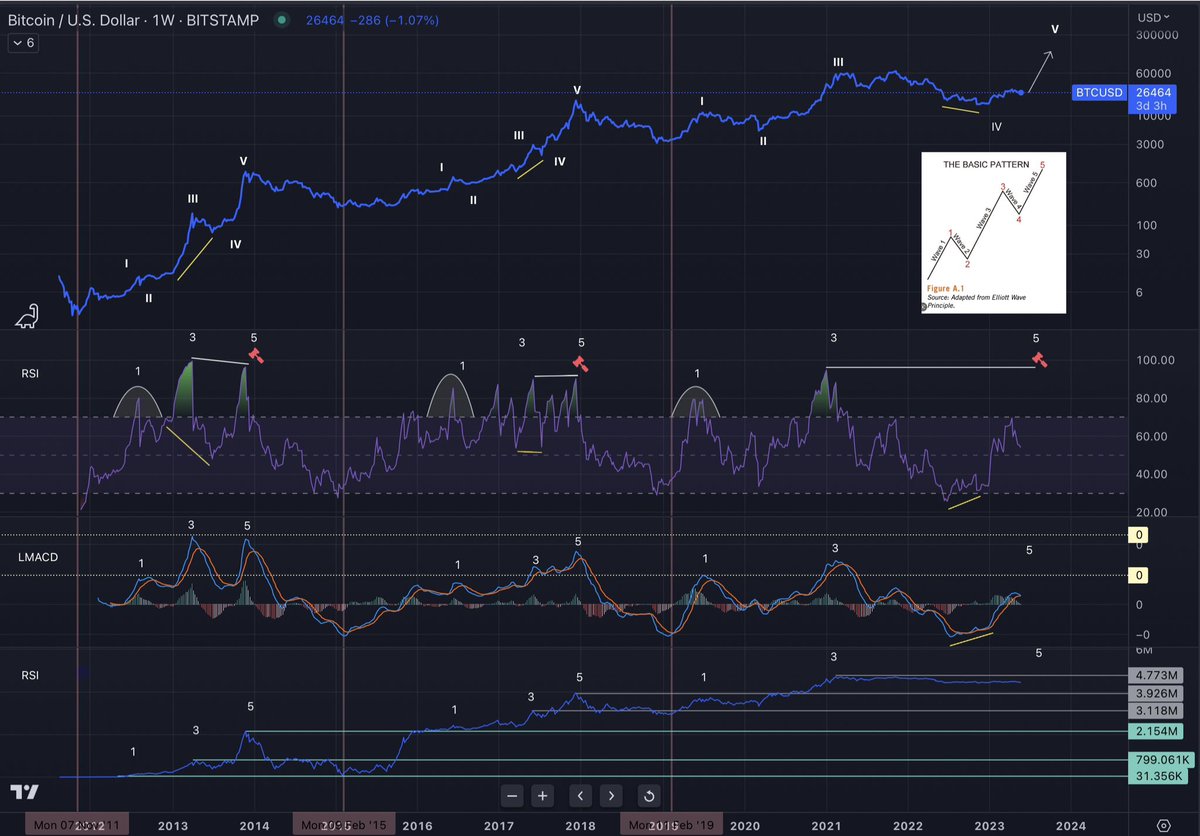
#BTC Most Bullish Scenario
Majority believes 🐻market rally
Minority believes start of a new 🐂cycle
Very few believe we’re at the end of 2019 cycle
Impulse wave 1,3, & 5 signatures are expressed in:
RSI✅
LMACD✅
On Balance Volume ✅
Cycle Completion: 140-200k 2023
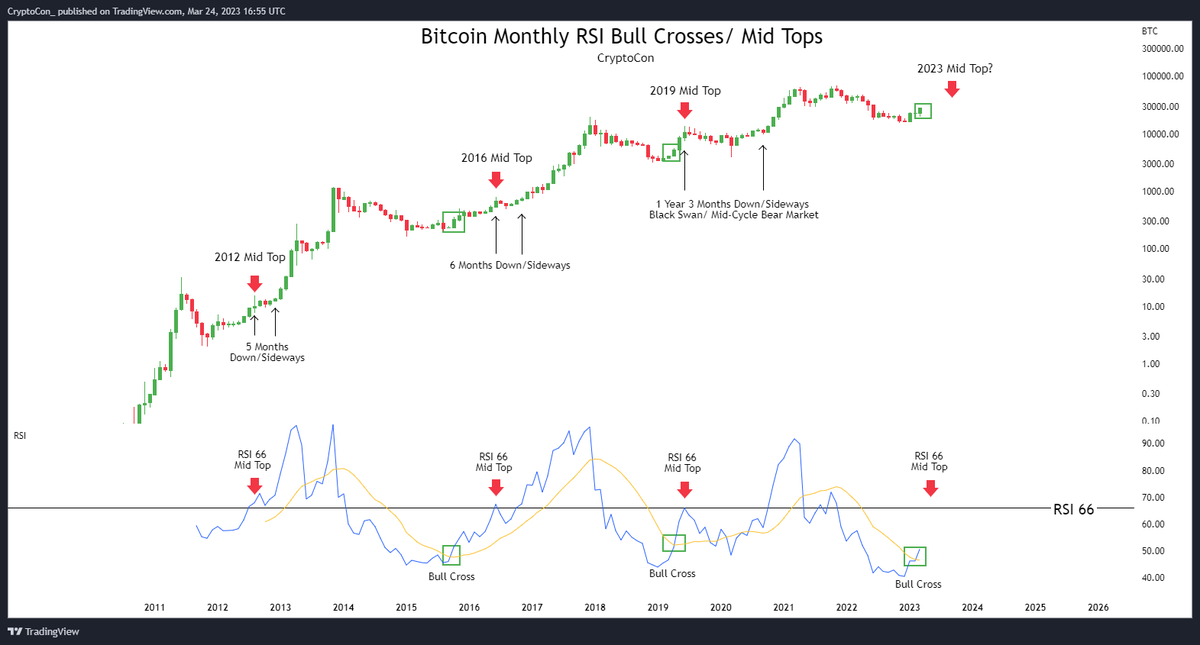
Last month the #Bitcoin cross of the Monthly RSI told us the Bull Market was here at $24,000
Now the cross is confirmed, and the next stop is the RSI 66 line where Bitcoin hits a temporary wall and forms mid-tops
There will be corrections, but Bitcoin is just getting started!