Desde ShareIT decimos presente en la 13a edición de @nerdearla 🇦🇷 🙌
Charlas, workshops y networking gratuitos sobre tecnología y open source.
📅 22 al 26 de septiembre
Registrate gratis 👉 https://t.co/WeLIewXpcJ
#Nerdearla
Mi tercer artículo, ahora sobre Cognitive Debt.
Es lo que sucede cuando delegas todo a los coding agents y no entendés realmente los resultados.
También cuento varias técnicas que vengo aplicando personalmente y en equipo.
As an AI Engineer. Please learn
>Harness engineering, not just prompt engineering
>Context engineering, not just long prompts
>Prompt caching vs. semantic caching tradeoffs
>KV cache management, eviction, reuse, and memory pressure at scale
>Prefill vs. decode latency and why they optimize differently
>Continuous batching, paged attention, and throughput optimization
>Speculative decoding vs. quantization vs. distillation tradeoffs
>INT8, INT4, FP8, AWQ, GPTQ, and when quantization hurts quality
>Structured output failures, schema validation, repair loops, and fallback chains
>Function calling reliability, tool contracts, argument validation, and idempotency
>Agent guardrails, loop budgets, tool budgets, and termination conditions
>Model routing, graceful fallback logic, and degraded-mode UX
>RAG architecture: chunking, embeddings, hybrid search, reranking, and freshness
>Retrieval evals: recall, precision, grounding, attribution, and citation quality
>Evals: golden sets, regression tests, adversarial tests, LLM-as-judge, and human evals
>LLM observability as a first-class discipline: traces, spans, tokens, latency, errors, and drift
>Cost attribution per feature, workflow, tenant, and user journey not just per model
>Safety engineering: prompt injection defense, data leakage prevention, and permission boundaries
>Multi-tenant isolation, cache safety, and cross-user context contamination prevention
>Fine-tuning vs. in-context learning vs. RAG vs. distillation and when each is the wrong tool
>Latency, quality, cost, and reliability tradeoffs across the full inference stack
>Production failure modes: hallucinated tool calls, malformed JSON, stale retrieval, runaway agents, and silent eval regressions
La telemetría de robots industriales trabaja de forma muy similar a los datos en F1 o motorsport en general
evento físico → sensor → dato → edge/cloud → base de datos → modelo de machine learning → decisión → acción
Lo que cambia es el problema a resolver, pero en esencia, siempre se trata de situaciones de maximización de rendimiento y optimización de recursos.
En F1 se busca reducir la degradación de neumáticos, incrementar la fiabilidad y maximizar el rendimiento.
Con los robots sucede lo mismo, nadie quiere que el robot se rompa y frene una fábrica entera. Se busca siempre maximizar la fiabilidad y el rendimiento.
En el medio entran varias cuestiones técnicas como la latencia y el sampling rate (frecuencia del dato).
Por un lado, necesitamos reducir la latencia: que es el tiempo transcurrido o delay entre el evento físico y la captura del dato.
Por el otro, entender a qué rate debe reportar cada sensor según el análisis que necesites hacer.
Hay variables que necesitan 1 Hz (1 dato por segundo) y otras necesitan +1 kHz (1000 datos por segundo) para el caso de las vibraciones de alta frecuencia.
Uno de los mayores desafíos de los procesos físicos es la no linealidad:
Una pequeña variación en una variable puede no generar ningún efecto o producir un cambio significativo, dependiendo del estado del sistema y de la interacción con otras variables.
Para esto se utilizan redes neuronales, árboles, gradient boosting, modelos físicos híbridos y métodos estadísticos.
Tanto en motorsport como en robótica, la ventaja no está solamente en capturar más datos, sino en capturar el dato correcto, con la frecuencia correcta y convertir eso en un activo con valor de mercado.
How to write good AI instructions for a semantic model: https://t.co/jnQ1QG1vjc
This article provides guidance about AI instructions in a semantic model for Copilot, Data agents, but also coding agents.
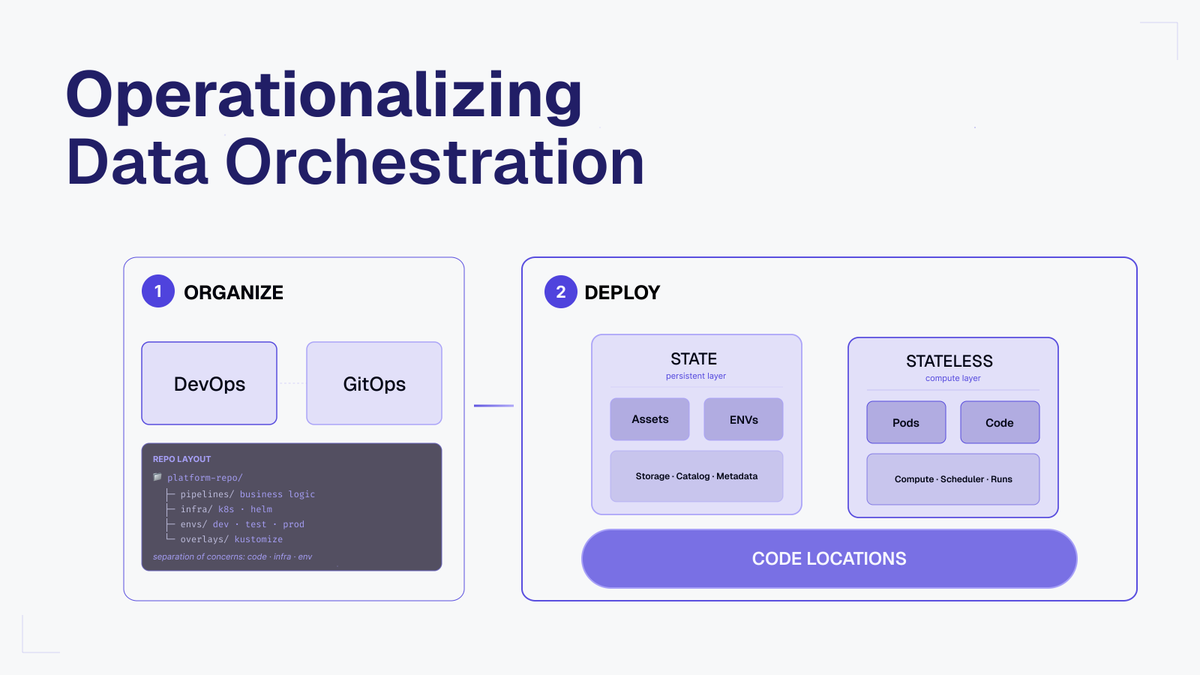
Operationalizing data orchestration is hard, and that's a pity, as it's at the heart and operating system of your data platform and every data work. You always need to schedule, run business logic on materialized data assets, or trigger a new pipeline to update the BI dashboard.
But what's even harder is deploying it across multiple environments and cloud solutions, or upgrading the infrastructure or only the pipeline. How does it sync with the data stack versions we use?
It's always a hassle; for that, we need to understand stateful and stateless components of our deployments, or we need to segregate business logic from technical logic, and from deployment logic. We need a clear structure for the deployment repo and a strong understanding of DevOps and GitOps, including tools like Flux, ArgoCD, and others.
In my latest article, I continue the Dagster's Almanack post with best practices on DevOps, infra, and code locations (DE workspaces).
You'll learn:
→The Challenges of Deploying Data Orchestration
→Best Practices for Running Data Orchestration: Organization vs. Deployment
→How Code Locations are the Key Piece to connect State and Stateless
→How to use a microservice-like approach to work with a central Open Data Orchestrator
→The different deployment mechanisms, such as Helm charts, Docker Compose, Kubernetes, ECS/VM, or using a hosted service.
→Guardrails and Pitfalls that are related to operationalizing data orchestration.
What's your choice on deploying data work? Do you separate business from technical logic, too? Do you have deployment configs with the workspace data library version and technical implementation in a single mono-repo, or how do you organize your data orchestration deployments?
Clase de analítica avanzada de datos aplicada a fábricas inteligentes en MIT
"the future is building physical things"
MIT está notando una caída en la cantidad de inscriptos en computer science y un aumento en carreras como ingeniería mecánica y electrónica.
La causa de fondo es Physical AI: la intersección entre inteligencia artificial y el mundo físico a través de la robótica, los sensores, los sistemas industriales y la manufactura avanzada.
La forma de aprendizaje de MIT se basa en investigación, desarrollo y práctica aplicada.
La base sigue siendo la misma: matemáticas, estadística y física.
Acá destacan que el conocimiento profundo se logra resolviendo problemas complejos y dominando esos tres pilares fundamentales.
El conocimiento de estadística es clave para desarrollar modelos de machine learning, especialmente cuando se trabaja con feature engineering: transformar datos crudos en variables útiles para que el modelo pueda aprender mejor.
En sistemas industriales, esto implica construir variables a partir de agregados matemáticos y estadísticos, ventanas temporales, tendencias, ratios, comportamientos físicos y conocimiento del proceso.
El éxito para crear soluciones dentro de Physical AI depende de:
Data + High Computational Power + Domain Knowledge
La dificultad no está solamente en desplegar modelos, sean decision trees, random forests o redes neuronales.
El punto principal sigue siendo la data: su calidad, su contexto y el entendimiento profundo de sistemas complejos dentro de una industria especifica.
Para resumir en criollo, en Physical AI no gana quien solo sabe correr modelos de machine learning, gana quien entiende datos, física, diseño de sistemas y dominio industrial.
I've created a benchmark that measures agent performance in basic Power BI report tasks, showing that directly modifying PBIR files is worse, more expensive, and (often) slower than using pbir-cli.
The tests evaluate 30 simple tasks like "create a card that shows the total invoice lines, using <tool or skill>" and a pass is when the agent can do it correct across 3/3 replicates. So if it does it 1 or 2 times, it still fails.
The results were quite interesting. A plugin with skills and small CLIs for validation didn't meaningfully increase performance much (esp not for Opus 4.8), but ballooned token cost and time. In contrast, the pbir-cli alone was sufficient to increase performance significantly on those tasks, and adding the skill made it faster and take less tokens. "Dumber" models took longer with the CLI because they spent more time exploring or iterating, and seem worse at using skills in general.
Obviously together with @maxanatsko I'm an author of the pbir-cli so it's appropriate to be skeptical of my benchmark that favors my own tool, but I did try to make these tests objective and fair.
Note this benchmark only evaluates performance as a function of "can it complete the task" not "do the report / visuals look nice". I'm building a design evaluation as well but it takes a lot longer since design is subjective and coming up with good, repeatable tests that aren't handwavy marketing bs (like "make the report from this image") is challenging.
Last week @AnthropicAI published an article about how they are having success with agents and analytics / BI.
The article had some useful insights and reminders that we highlight in this week's Tabular Editor blog.
Link (Tabular Editor Blog): https://t.co/kz4p4r2SJL
Original article (Anthropic): https://t.co/GAeFUC7W9x
A few highlights in a nutshell:
- Remember that success with BI / analytics is not a technical KPI / problem. Just because an agent is generating most of the queries and getting them correct doesn't mean it's bringing business value. User training and adoption should never be neglected - AI or no AI.
- The fundamentals are more important than ever. Reminder: If you get these fundamentals right, it's going to help you get success with BI across the board... with or without AI. This includes dimensional/semantic modelling, data quality, governance/oversight, and source control and automated testing with CI/CD. The tools we make at Tabular Editor (such as our new CLI) are laser-focused on this problem.
- We should be treating metadata, skills, and documentation as first-class citizens. This means that they are human-owned and curated, but also in source control and ideally also tested before use or distribution. Agents can help, but shouldn't create the context de novo.
- Some things we may need to re-think, such as co-location of artifacts in workspaces rather than separating them by item type, or telling self-service users to use PBIX + OneDrive if they want to use agents, instead of metadata-first formats.
Data engineering spent fifteen years building orchestrators — Airflow, Dagster, Prefect, Kestra.
We are now doing the same thing for AI agents. Agor from Maxime Beauchemin, the original creator of Airflow. Agent Teams from Anthropic, native to Claude Code. Omnigent from Databricks. Superset-sh, anvil, herdr, Gastown from Steve Yegge.
Entramos en una nueva era del desarrollo de soluciones
En esta nueva era los devs deben ir más allá, cumpliendo estos 5 puntos principales:
1. ser curiosos
2. pensar en sistemas
3. saber comunicar: ser específicos para reducir la ambigüedad
4. tener ownership: you build it, you own it
5. polymath: equivale a ser polivalente y tener conocimiento de varias disciplinas
Además, lo ideal es especializaste y tener conocimiento profundo sobre un tema en particular, dominándolo por completo (por ejemplo, databases para real-time data con baja latencia).
Dr. Werner Vogels, CTO de Amazon, lo explicó como una T-shaped, compuesta por:
1. depth: profundidad
2. breadth: amplitud
Dentro de esta T los devs deben lograr un mix entre personal skills, functional skills e industry specific.
Para dar un ejemplo, podes ser analista/ingeniero de datos en general (breadth) y especializarte en motorsport (depth) logrando una alta especialización en modelos de degradación de neumáticos.
En F1 no te pagan por tener el modelo de machine learning más lindo o más avanzado, te pagan por lograr que el auto vaya más rápido. El código del modelo simplemente es la forma de hacerlo.
Hay una frase de Jim Gray que dice: "give me the 20 most important questions to ask of your data, and i will design the system for you".
El desarrollo de software jamás se trató de escribir código, siempre se trató de solucionar problemas del mundo real y aportar valor.
En esta nueva era eso se maximiza, porque el código lo escriben los agentes pero debe ser validado y orquestado por humanos con conocimiento especifico.
Por lo tanto, el valor de los devs es saber diseñar sistemas, escalarlos y mantenerlos seguros. Pero sobre todo, siempre se trató de solucionar problemas y aportar valor al usuario final.
🚨 @Karpathy predicted the power of the "LLM Wiki." Google just formalized it.
Meet Open Knowledge Format (OKF): a vendor-neutral standard for giving foundation models the curated context they need.
I can genuinely see this replacing Notion, Obsidian, or traditional wikis for developer teams, and the reason comes down to bookkeeping.
Traditional wikis fail because humans inevitably abandon the tedious work of updating them.
As Andrej Karpathy pointed out recently, LLMs don't get bored.
They don't forget to update a cross-reference, and they can touch 15 files in a single pass.
OKF standardizes the interoperability layer so agents can actually do that heavy lifting autonomously.
Because the format is minimally opinionated, it doesn't dictate what you write, it just dictates how it's structured. You get:
→ Human-readable documents that live right alongside your code in version control
→ Cross-links that map out complex entity relationships without needing a graph database
→ A system that survives moving between different tools and organizations
There is no complex compression scheme.
No central registry.
If you can cat a file, you can read it.
If you can git clone a repo, you can deploy it.
This is how we stop rebuilding context pipelines from scratch every time a new model drops.
Announcement + spec file in 🧵↓
@NicolasUSilva Si manejas bases de datos le podes sumar un grafo con los datos y sus relaciones para un análisis cruzado y mayor precisión en las respuestas
I have five principles for my data engineering writing.
Quality over quantity.
Evergreen over trending.
Developer-centric over hype.
Value over marketing.
Continuous over done.
A preview of the next version of the pbir-cli, which can refresh and screenshot the Power BI canvas using the new Power BI desktop preview feature from Microsoft.
This makes the agent a lot more powerful, and the experience more fun / satisfying. View in full-screen!
Iceberg, Delta, Hudi — everyone fights about the table format.
The real lock-in is one layer up: the catalog. Whoever controls the catalog controls which engines can read your tables, which features you get, and how easily you can leave.
Two of the most used terms when modeling data correctly are cardinality and granularity.
Related data modeling terms are normalization and denormalization, dimensional modeling, and many-to-many relationships.
---
Granularity: This process involves determining what each row in a fact table represents, laying the foundation for the entire design.
Cardinality: The cardinality of a column in a database table refers to the number of distinct values in that column.
Normalization: Database normalization is the process of structuring a relational database according to a set of normal forms to reduce data redundancy and improve data integrity. It was first proposed in the early 1970s by British computer scientist Edgar F. Codd as part of his Relational Model.
Denormalization: a strategic process in which we introduce precomputed, redundant data into an otherwise normalized database structure. This technique is primarily used to improve database read performance.
Dimensional Modeling: Dimensional Modeling (DM), integral to the Kimball DW and BI Lifecycle Methodology, also known as Business Dimensional Lifecycle methodology, was developed by Ralph Kimball. It encompasses a suite of methods, techniques, and concepts essential for Data Warehouse design.
Many-to-Many Relationships: The concept of many-to-many relationships is pivotal, especially for understanding the nuances of purchasing or selling an item. Such relationships depict a scenario in which a sale might be linked to multiple reasons, and, conversely, a sales reason could be associated with multiple sales. This dual linkage is a core aspect of many-to-many relationships.
And many more, see the map of content at data modeling with its backlinks and connected notes: https://t.co/E1wTVK17CZ