Minnesota vs Indiana
Play
Under 138.5
Confidence
66%
Edge
6 points
Grade
A-
Breakdown
Tempo is the story here. Minnesota runs one of the slowest offenses in the country.
Minnesota tempo 62.4
Indiana tempo 65.9
Projected possessions
63–65
Both teams average over 18 second possessions which kills scoring volume.
Offensive efficiency
Indiana 121
Minnesota 107
Defensive efficiency
Indiana 103
Minnesota 103
Projected score
Indiana 69
Minnesota 65
Georgetown +16.5 at St John’s
PLAY
Georgetown +16.5
Confidence
71%
Grade A
Edge 10.5 points vs projection
Breakdown
Projected possessions sit around 67.
St John’s defensive efficiency is 95. Elite. But Georgetown’s offense is 115. That translates to roughly 1.05 points per possession in this matchup.
Over 67 possessions that lands Georgetown around 69 to 71 points.
St John’s offense projects near 1.13 PPP against Georgetown’s 106 defensive efficiency. That puts St John’s around 75 to 77.
That script lands roughly 76 to 70.
For St John’s to cover 16.5, they likely need to push into the mid 80s or hold Georgetown in the low 60s.
But Georgetown shoots 53 eFG and has multiple perimeter creators. They are not an offensive collapse team.
Tempo is moderate. Not high volume. Blowouts require extra possessions or extreme efficiency spikes.
Add in ATS data. Georgetown is 5–2 as a double digit underdog. St John’s is 4–6 laying double digits.
This plays out as controlled win. Not runaway.
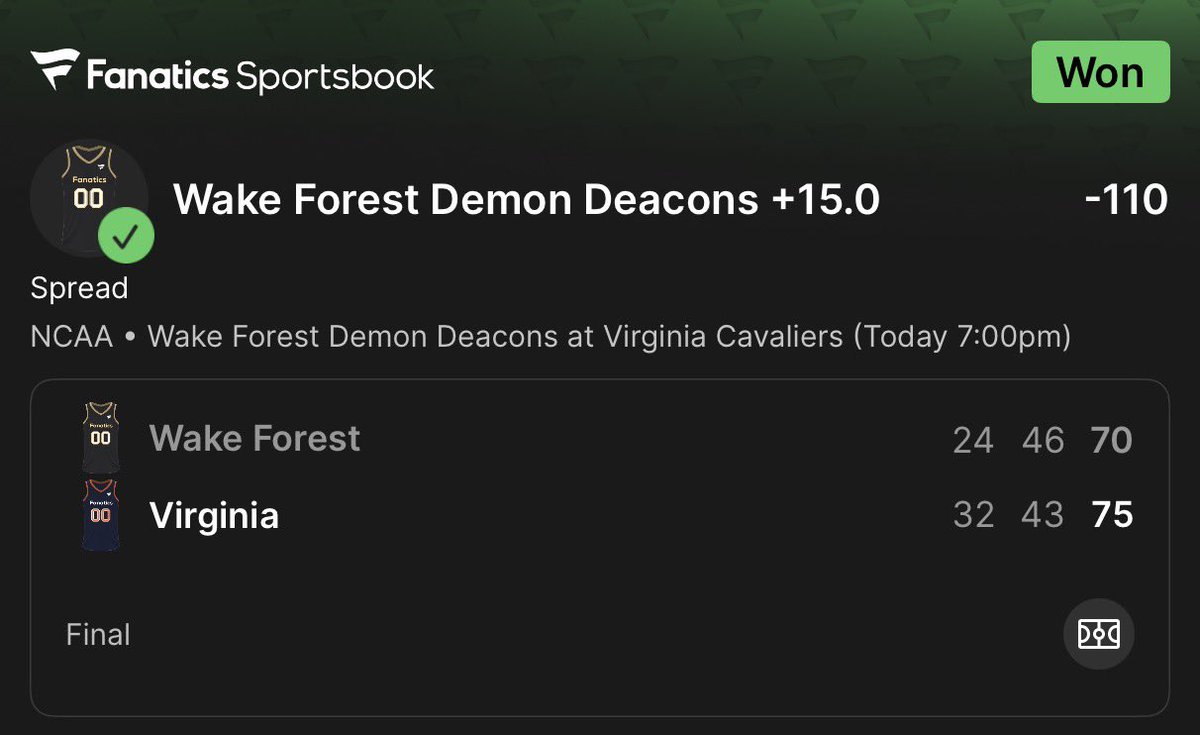
Wake +14.5 at Virginia
PLAY
Wake +14.5
Confidence
67%
Grade A-
Edge 8.5 points vs projection
Breakdown
Virginia plays at roughly 61 possessions per game. Wake plays near 69. But at home Virginia dictates pace.
Projected possessions around 65.
Virginia projects near 1.11 PPP. Wake around 1.02 PPP.
That creates a score profile around 72 to 66.
That is a 6 point game.
Virginia wins by controlling half court, using long possessions and strong defensive rotations.
They do not create large transition bursts. They are not a pace expansion team.
To cover 14.5 in a 65 possession game, Virginia would need sustained 1.25 plus PPP or hold Wake under 0.95 PPP.
Wake averages 79 per game overall and is capable offensively.
Virginia ATS as a double digit favorite is 5–7. Wake is 3–1 catching double digits.
This likely plays out as 10 to 12 point Virginia win. The number assumes more than the tempo allows.
Wake vs Virginia
PLAY
Under 148.5
Confidence
69%
Grade A-
Edge ~10 points vs projection
Breakdown
Projected possessions roughly 65.
Virginia defensive efficiency 95. Wake offensive efficiency drops significantly against elite half court teams.
Blended PPP estimate sits around 2.07 combined.
2.07 x 65 possessions equals roughly 135 to 140.
Virginia uses 20 second possessions when leading. That compresses second half pace.
Wake wants to run, but Virginia controls tempo in Charlottesville.
To clear 148.5 in 65 possessions, both teams need to average 1.15 PPP.
That is above expectation in this matchup.
This likely plays out in the 68 to 64 or 72 to 66 type range.
Play
Nicholls +10.5
Confidence
64%
Grade
B
Breakdown
McNeese is elite defensively in this league. 103.1 adjD with a top 60 profile nationally. They force turnovers on 24.6% of possessions and block shots at a high rate.
But Nicholls plays faster at 68.4 tempo and shoots 54.7% eFG defensively allowed which is poor. That is why the spread is inflated.
Here is the key. McNeese already beat them 94 to 68. That is baked into this number. You are paying for that result plus public money.
Splits show
94% of moneyline tickets on McNeese
Over 70% of spread money on Nicholls
Line opened -11.5 and is sitting -10.5
This is a tax number on the best team in the conference.
Nicholls has covered in tighter tempo games. McNeese does not push pace. Blowouts require shooting variance.
This number should be closer to -6/7.
South Carolina State +2.5
Confidence 62%
Grade A-
Edge 3.5 points
Breakdown
KenPom baseline makes this SCST -1 on a neutral number. Market is giving you +2.5. That is a 3 to 4 point swing in a 67 possession game. That matters.
Projected possessions 67
Projected score
SCST 71
DSU 70
Offensive efficiency edge goes to SCST
AdjO 95.2 vs 88.4
DSU is bottom tier nationally in scoring efficiency and eFG at 42.6%. They also shoot just 42.3% from two. That is not a profile that stretches a weak defense.
SCST defense is poor, but DSU does not have the shot quality or spacing to consistently exploit it.
Rebounds are identical at 30.7 each. No structural edge there for DSU.
Both teams turn it over above 19%. Sloppy offense plus low efficiency keeps scoring compressed and variance tight.
DEP +4.5
Confidence 67%
Edge 4.1
Grade: B+
Breakdown
Market is pricing Marquette like a clear tier above. The math does not agree.
KenPom baseline projects this basically even on a neutral. My 10k simulation made Marquette less than a one point favorite. You are getting 4.5. That is cushion in a mid 60s possession game.
DePaul defense is real. 102.0 adjusted. Top 45 nationally. They contest the arc and protect the paint well enough to avoid runs.
Marquette defense is 104.9 adjusted and allows clean perimeter looks. DePaul shoots 33% from three and takes almost 40% of attempts from deep. That is live dog variance.
Turnovers matter. Marquette forces steals. But DePaul’s assist rate is strong and they have multiple ball handlers. If they stay under 16% turnover rate this game tightens immediately.
First meeting was 80–75. Five point game. That was on DePaul’s floor. Nothing in that matchup screams separation.
La Salle vs Davidson
PLAY: La Salle +10.5
Confidence: 64%
Grade: B+
Edge: 7.5 pts
Breakdown
Projected margin Davidson -3. Market -10.5. That is a massive gap.
Both teams bottom tier in tempo. 63 to 64 possessions. Slow pace makes double digit spreads dangerous.
Davidson is perimeter heavy but not dominant defensively. 105 AdjD. La Salle cannot shoot but rebounds at 33 percent and gets to the line.
Slow game. Possessions limited. That keeps this inside the number more often than not.
Testing -
SAINT JOE’S vs RHODE ISLAND
SAINT JOE’S +3.5
Confidence: 72%
Projection makes Saint Joe’s a small favorite. Market has them catching 3.5. That is over a 5 point swing from true number.
Projected pace upper 60s. Offensive efficiency favors Saint Joe’s. Better spacing. More reliable half court scoring.
Rhode Island can stall offensively and has turnover issues. That shows up in tight games.
The sim has Saint Joe’s covering over 70% and winning outright close to 60%.
Wrong favorite by the math. Value is clear
SLU vs Dayton
Play
Under 155.5
Confidence 69%
How it plays out
The book is hanging a mid 150s total, but the math lands closer to low 150s. That is the gap we want. SLU can score, but Dayton is built to make you work and shorten clean looks. If Dayton is even slightly live, the game stays out of full track meet mode and the under is in control.
Numbers that matter
Projected pace 69.7 possessions
SLU expected points 78.0
Dayton expected points 73.4
Projected total 151.3
Kentucky -7.5
Confidence: 60%
Kentucky walks into this game as the more complete team. They score at all three levels and they rebound with force. South Carolina does not have the depth or offensive efficiency to trade baskets for 40 minutes.
Start with the matchup inside. Kentucky attacks the rim and crashes the offensive glass. South Carolina gives up second chances and does not protect the paint consistently. That is a problem against a team that can score through contact and finish over size. If Kentucky controls the glass, they control the game.
On the perimeter, South Carolina is streaky. They do not shoot it well from three and they rely heavily on free throws to stay afloat offensively. Kentucky’s defense is not elite, but it is disciplined enough to avoid bailout fouls. If South Carolina is forced to score in the half court without living at the line, their offense stalls.
The biggest risk here is pace. South Carolina prefers a slower game. Fewer possessions always tighten spreads. That creates backdoor potential late if Kentucky is up eight or nine with a minute left. That is the only real concern laying points on the road.
The line opened shorter and was pushed up. That move matters. Even with the public backing Kentucky, the market did not buy back on South Carolina. That tells you the number was cheap early.
Kentucky has the better offense.
Kentucky rebounds better.
Kentucky has more reliable shot creation late.
GB at Detroit Mercy
Best Play
Under 147.5
Confidence
67%
Edge
+8.1
This game profiles slower than the market is pricing.
Green Bay adjusted tempo 62.8. That is bottom tier nationally. They are comfortable grinding possessions deep into the clock. Detroit sits at 69.0 but against slow teams they are forced into half court offense.
Projected possessions 66.
Efficiency blend gives us:
GB offense 112.5
DET defense 114.7
DET offense 108.1
GB defense 116.3
That projects to:
Detroit 71
Green Bay 68
Projected total 139.4.