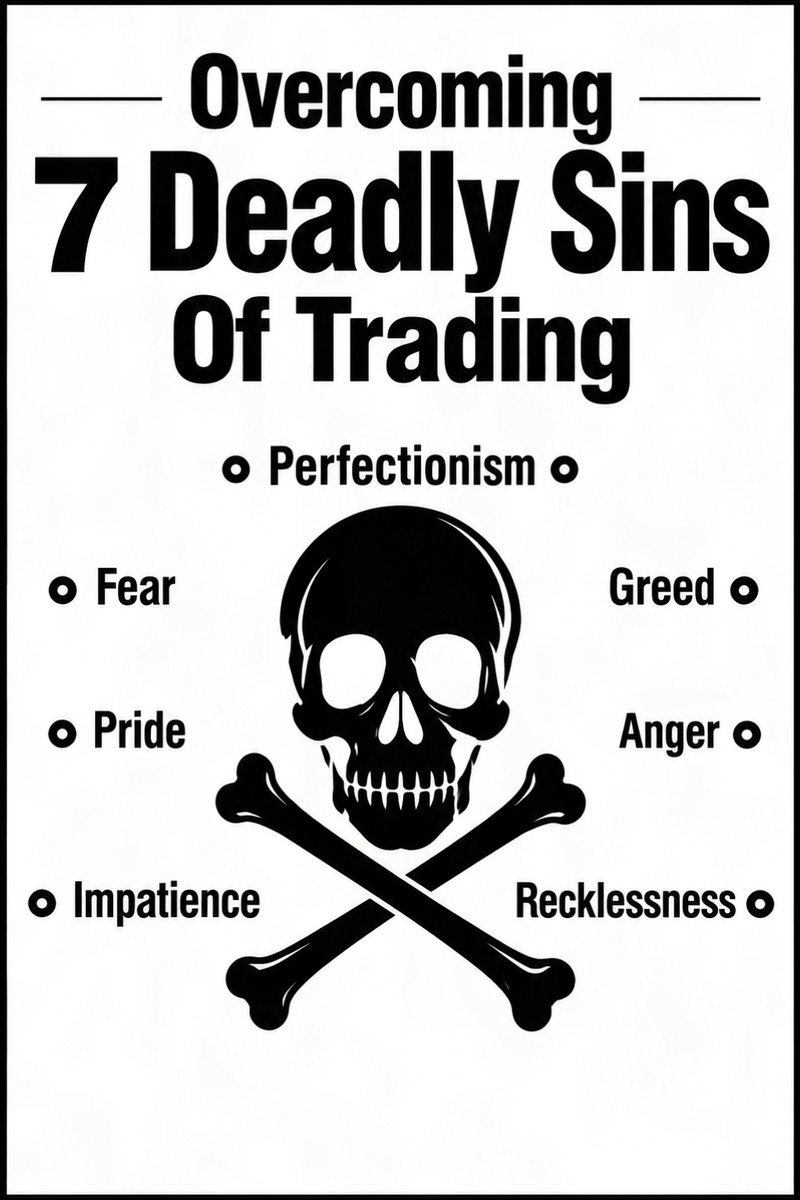
Overcoming the 7 Deadly Sins of Trading:
Here are some of the more common “sins” that will cost you money in the market until you learn to overcome them.
1. Perfectionism: There is no perfection in trading, as far as making money on every trade or having a perfect system. All you can hope to be perfect at is following your system, rules, and trading plan. A winning trade should be measured as one in which you followed all your preset guidelines.
Even the best traders average only about a 50%-60% win rate over long periods. The key is having bigger winners than losers, not being perfect. Like in baseball, where a .300 hitter can get into the Hall of Fame. A .500 trader in the market can become wealthy if his wins are much bigger than his losses.
2. Fear: Faith in your system is the only way to overcome your fear of trading. You must complete enough backtesting on your system to know that you have a valid edge over the market in the long term.
You must see opportunity in trading and accept that there may be losses. You must take your system's trade signals each time, and if you can’t overcome your fear of loss and failure, then perhaps trading is just not for you.
Traders are entrepreneurs, not employees; they get paid only when successful, and there is no guaranteed paycheck.
3. Pride: We are not our trading account, and staring too much at our profit and loss is a major detriment to our trading.
Traders must cut losses at their predetermined stop, not hang on, prideful, trying to prove they are right. We must separate ourselves from the trading.
A person’s value is not tied to a trade or performance record. If we followed our system, then we couldn’t view that as a personal loss. The market was just not conducive to the system that we followed with discipline.
4. Impatience: Wait and only take your entry signal when it is time, and not a tick before your system triggers the trade. It’s important to let our profits run as far as they will go and not prematurely take them until the trend has run its course.
We need to give our trades room to breathe and not cut our losses until the system confirms we are wrong and it is time to do so.
5. Greed: Traders should not chase a trade when it is too late. We must take our profits off the table when the time comes, and we should never allow a winner to turn into a loser. If these things happen, you have no one to blame but your own greed.
Overtrading and trying to make more money when our system does not say it is time are born of greed and usually end in a negative P&L statement.
6. Anger: Do not get mad at yourself. Learn from your mistakes and move on. Every mistake gets you closer to learning what you need to do to become consistently profitable.
Do not get mad at the “market,” it is a voting machine, not an entity. Accept your losses and begin again.
7. Recklessness: Trading with too large a position size is risky, reckless, and completely unnecessary. Only enter appropriately sized trades with preplanned stop-loss orders and trailing stops to lock in profits while they are there.
How to repent from your trading sins:
Follow your system and rules, and if you find yourself hoping and wishing the market would stop moving against you instead of making decisions based on facts, you should exit that trade immediately.
We first need to realize which trading “sins” we are guilty of, and then we can decide to repent and no longer commit them.
The good trader will realize that any single trade is only one in a long string of trades and will move on to the next, knowing that his system will outperform in the long term.
He will have complete faith in his trading methodology and risk management. He walks by faith in his system's edge, not by the last trade that may have lost money, but by the knowing that he’s back-tested his system enough to know the long-term outcome.
The good trader is humble and knows that he can't outsmart the whole market every day and that trying to do so is futile.
His system simply gives him one small advantage that he can exploit time and time again if he’s patient and waits for the right entry signal.
He is happy with the profits he earns and has no desire to put on a huge trade and swing for the fences.
He does not get angry because he has no one to get angry at. He is very careful in his trading and follows his trading plan 100%.
The stock market giveth and the stock market taketh away. Real traders love every minute they get to participate in the financial system, which is the stock market.
How to Find the New Leading Stocks in the Market:
One of the biggest mistakes traders make after a correction is trying to find “cheap stocks.”
Instead, I want to find the stocks that are already proving they’re stronger than everything else.
This is where Relative Strength comes in.
And no, I’m not talking about RSI.
Relative Strength is simply comparing how a stock is performing versus the broader market (SPY/QQQ) and its sector.
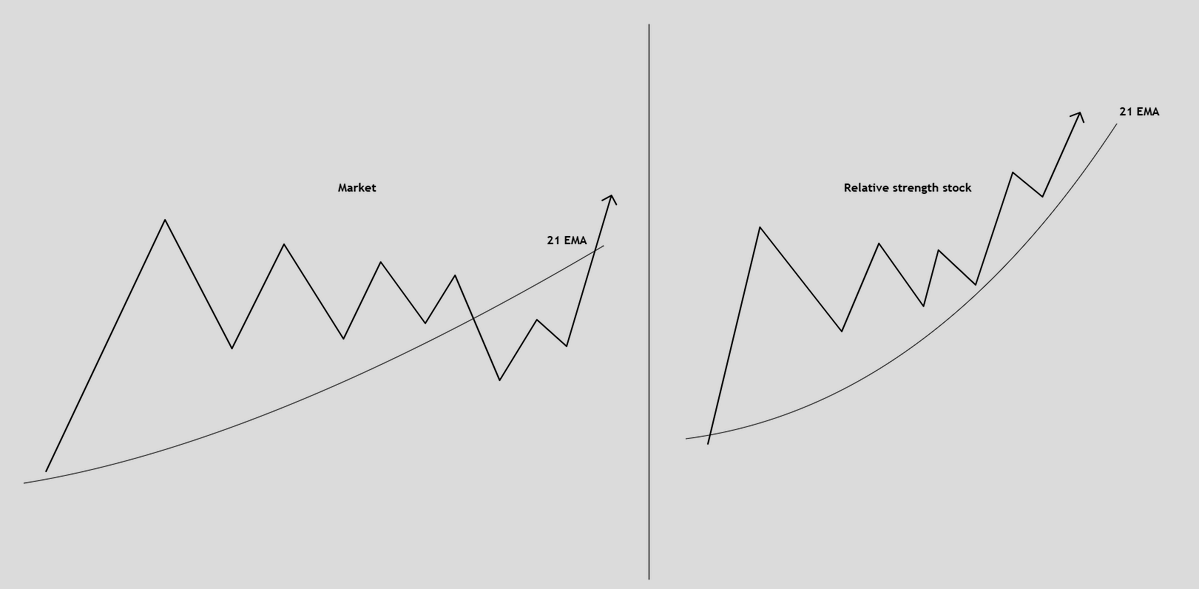
The easiest time to spot this is actually during a market pullback.
Imagine QQQ is:
-Making lower lows
-Losing its 8 EMA
-Testing/breaking its 21 EMA
-Experiencing several days of selling
Meanwhile, one individual stock is:
-Making higher lows
-Holding above its 8 EMA
-Consolidating tightly
-Closing near its highs
-Refusing to sell off
That divergence tells you that institutions continue to accumulate the stock
The entire market is experiencing selling pressure, yet this stock refuses to break.
Why?
Potentially because there is enough underlying demand to absorb the supply coming into the market.
I think of these stocks like a coiled spring.
The broader market is temporarily acting as a headwind. But while everything else is pulling back, the leader is quietly building a tight base.
Then SPY/QQQ eventually stops falling and catches a bid.
The headwind disappears.
&
because the leader was already strong, it can be one of the first stocks to break out and accelerate when market conditions improve.
This is why market pullbacks are so valuable for building watchlists.
Weak markets expose strong stocks.
From there, I take the analysis one step further:
MARKET → SECTOR → STOCK
First, determine the direction of SPY/QQQ.
Second, identify which sectors are outperforming the market.
Third, find the individual stocks leading those sectors.
If a sector is making new highs while the broader market is flat or pulling back, pay attention.
Then find the stock within that sector that's:
→ Breaking out first
→ Making new highs first
→ Holding moving averages best
→ Showing the highest relative volume
→ Outperforming its peers during market weakness
That's where you can start identifying the true market leader.
One of the strongest forms of Relative Strength can also come after earnings.
A company reports strong growth, beats expectations and raises guidance.
The stock gaps significantly higher on massive volume.
Instead of immediately assuming the move is over, watch what happens next.
If it holds near the highs, trades tightly, defends its moving averages and ignores broader market weakness, that earnings gap may have created an entirely new institutional leader.
The framework is simple:
Don't buy the laggard because you hope it catches up.
Study the stock that's already proving its strength.
My Relative Strength checklist:
✓ Outperforming SPY/QQQ
✓ Higher lows during market weakness
✓ Defending key moving averages
✓ Strong sector
✓ Leading stock within that sector
✓ Volume confirming the move
✓ Strong catalyst when applicable
✓ Tight, constructive price action
The goal isn't to predict which stock might become a leader.
Let price action show you which stocks are already becoming leaders.
In a bull market, almost everything can go up.
The leaders just go up faster.
نصيحة للمتداولين: لا تحصر نفسك في Finviz.. إليك 4 فلاتر ذهبية في TradingView 🚀
يستخدم الكثير من المتداولين فلاتر موقع Finviz الشهيرة، لكن الكثيرين لا يعلمون أن منصة TradingView توفر فلاتر (Screeners) احترافية تمنحك دقة عالية ورصداً مباشراً لحركة الأموال.
إليك أهم 4 فلاتر مجانية يمكن استخدامها يومياً وأسبوعياً لتطوير الأداء:
1) فلتر "أقوى الرابحين" (Best Winners)
هذا هو الفلتر الجوهري للبحث عن أقوى الأسهم والقادة الحقيقيين في السوق. يتميز برصد الزخ�� العالي والقوة النسبية والاتجاهات الواضحة. هذه هي الأسماء التي يمكن أن تصبح رابحة لعدة أسابيع متتالية إذا سمحت ظروف السوق بذلك.
🔗 https://t.co/xmc0A6jysX
2) فلتر "القوة اليومية" (Daily Strong)
فلتر يعطي "رد فعل السوق" الصافي. يُنصح بتشغيله يومياً لمعرفة أين تتدفق الأموال؛ فهو يوضح ما إذا كانت القوة تتوسع أم تجف — بدون آراء شخصية وبدون ضجيج.
🔗 https://t.co/hwe3JDGN1u
3) فلتر "البيع المكشوف" (Short Screener)
تزداد أهميته خاصة في الاتجاهات الهابطة. يرصد الأسهم المنهكة التي فقدت زخمها وظهرت عليها ردود فعل ضعيفة أو قمم فاشلة. المتداول المحترف لا يخمن صفقات البيع — بل يستعد لها.
🔗 https://t.co/ptju1cMTzN
4) فلتر "ما قبل الافتتاح" (Pre-Market)
لمراقبة الفجوات السعرية (Gap-ups)، وأحجام التداول غير العادية، والمحفزات الجديدة. الهدف ليس المطاردة — بل المراقبة وإعداد خطط مهيكلة قبل أن تتدخل العواطف مع بداية الجلسة.
🔗 https://t.co/7qmEe8buAP
الحقيقة التي يجب معرفتها:
الفلتر في حد ذاته لا يمنحك الأفضلية، بل معرفة كيفية قراءته هي ما يصنع الفارق.
الفلاتر هي مجرد أدوات، والخبرة والممارسة هما ما يحولان هذه الأدوات إلى سلاح فعال. هذه الأنماط تتكرر دائماً، وإتقان التعامل معها مهارة يمكن لأي متداول اكتسابها مع الوقت.
Market Wizard Linda Reschke's 12 Technical Trading Rules:
1. Buy the first pullback after a new high. Sell the first rally after a new low.
2. Afternoon strength or weakness should have follow through the next day.
3. The best trading reversals occur in the morning, not the afternoon.
4. The larger the market gaps, the greater the odds of continuation and a trend.
5. The way the market trades around the previous day’s high or low is a good indicator of the market’s technical strength or weakness.
6. The previous day’s high and low are two very important “pivot” points, for this was the definitive point where buyers or sellers came in the day before. Look for the market to either test and reverse off these points, or push through and show signs of continuation.
7. The last hour often tells the truth about how strong a trend truly is. “Smart” money shows their hand in the last hour, continuing to mark positions in their favor. As long as a market is having consecutive strong closes, look for up-trend to continue. The up trend is most likely to end when there is a morning rally first, followed by a weak close.
8. High volume on the close implies continuity the next morning in the direction of the last half-hour. In a strongly trending market, look for resumption of the trend in the last hour.
9. The first hour’s range establishes the framework for the rest of the trading day.
10. A greater percentage of the day’s range occurs in the first hour then was the case in the past, and thus it has become increasingly important to trade aggressively if there are early signs of a strong trend for the day.
11. There are four basic principles of price behavior which have held up over time. Confidence that a type of price action is a true principle is what allows a trader to develop a systematic approach.
The following four principles can be modeled and quantified and hold true for all time frames, all markets. The majority of patterns or systems that have a demonstrable edge are based on one of these four enduring principles of price behavior.
Charles Dow was one of the first to touch on them in his writings. Principle One:
A Trend Has a Higher Probability of Continuation than Reversal Principle Two:
Momentum Precedes Price Principle Three:
Trends End in a Climax Principle Four:
The Market Alternates between Range Expansion and Range Contraction!
12. In the world of money, which is a world shaped by human behavior, nobody has the foggiest notion of what will happen in the future. Mark that word –
Nobody! Thus the successful trader does not base moves on what supposedly will happen but reacts instead to what does happen.
I tested every indicator for 10 years:
MACD,
Bollinger Bands,
Stochastics,
Fibonacci,
Volume Profile,
Order Flow.
After $83K in losses,
I only use TWO:
1. RSI (tells me when to enter)
2. Moving Averages (tells me the trend) That's it. Everything else is noise.
My 3-rule system for 95% win rate:
Rule 1: Only sell puts on red days (RSI <50)
Rule 2: Target 5% return in 30 days
Rule 3: Close at 50% profit (5-7 days) Simple systems win.
Complex systems lose.
Every time.
Most novices think that profitability comes from finding winners - lots of luck with this one
Long-term profitability has much more to do with cutting losses quickly
Being a big winner is a matter of being an excellent loser
I am sharing One of My most Popular Breakout Scanner , that I scan almost each day.
It helped me find out many stocks that I share with all of you.
One among them was : NRL
https://t.co/cQwrpCEOTf
Most traders use RSI.
Very few understand how to use it with the trend.
That's where the RSI 60–40 + 21 EMA + 50 EMA framework changes everything.
Here's the idea:
🟢In a strong uptrend:
• Price stays above the 21 EMA & 50 EMA.
• RSI often finds support near 40 → High-probability pullback opportunity.
• RSI pushing above 60 → Momentum is returning and the trend is ready to continue.
The edge isn't the indicator.
The edge is the confluence between:
✅ Market Structure
✅ Dynamic Support (21 EMA & 50 EMA)
✅ RSI 40–60 Behavior
✅ Price Action Confirmation
✅ Strict Risk Management
Remember:
❌ Don't buy just because RSI is at 40.
❌ Don't buy just because RSI crosses 60.
Wait for price confirmation.
Indicators only support the decision.
Price always makes the final decision.
📌 Save this note and study it before your next trade.
💬 Have you ever combined RSI with the 21 EMA and 50 EMA? Share your experience below.
Follow @ChartMantra_ for practical trading education, high-probability setups, and risk management that help you trade with discipline-not emotions.
♻️ Repost if this added value to your trading journey.
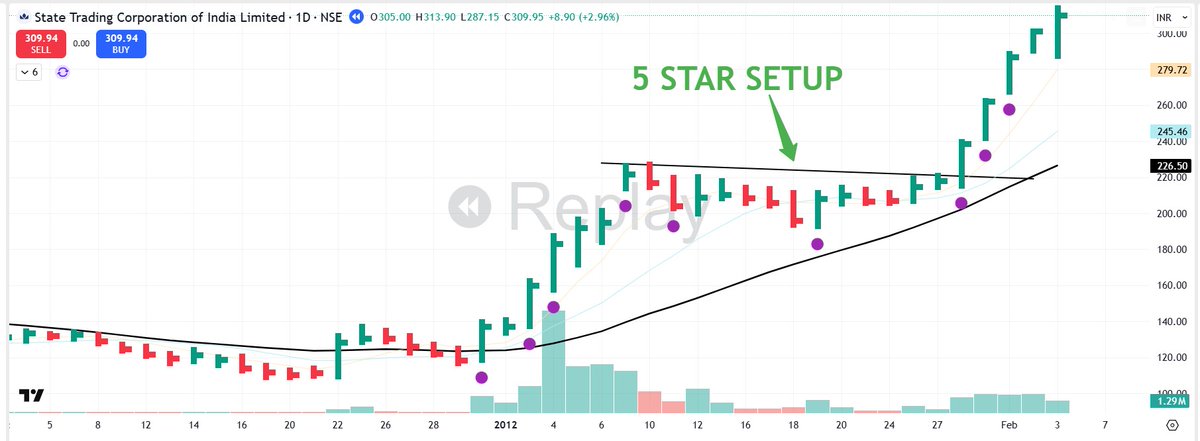
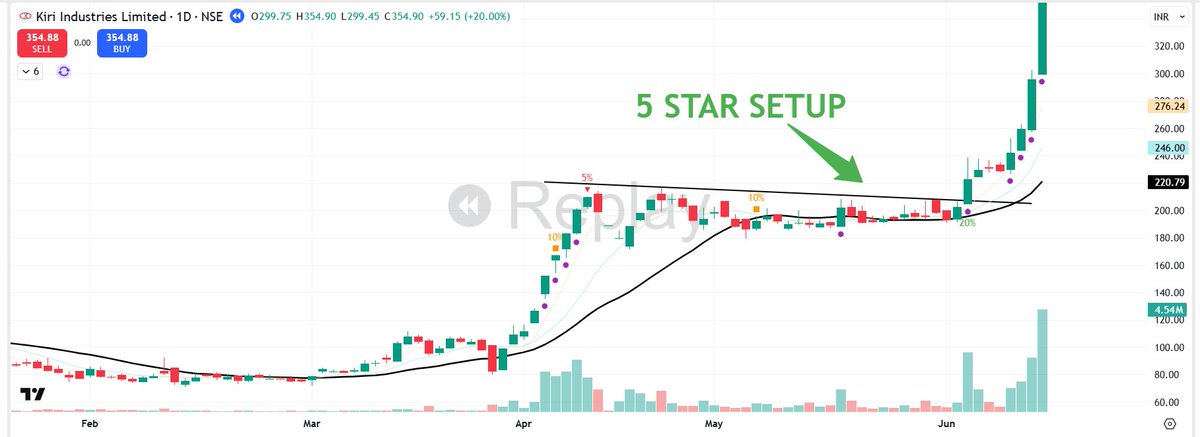
💥💥5-Star setups are rare — but they pay for entire months
Here’s what I demand before I take one 👇
1⃣Strong Momentum:
Stock is up 70-100% before.
2⃣Clean Pattern:
Tight base, flag, or VCP. No noise. Higher lows inside the base.
3⃣Strong Theme:
Stories with real momentum. Hot themes.
4⃣Explosive Growth:
If available: EPS +50% and/or sales +20% YoY. Institutions want this.
5⃣Volume Clues:
Multiple up days on 2x volume. Funds are already loading
6⃣Liquidity:
Easy in, easy out.
These are the trades that move +50–100%.
One of the biggest misconceptions newer traders have is thinking the “easy money” is gone after a stock makes a large move.
In reality, the best stocks rarely go straight up forever.
The strongest names will impulsively expand, get extended from the 21EMA, then spend time consolidating, tightening up, and allowing the moving averages to catch up underneath price.
That reset is where the next opportunity forms.
Why?
Because institutions can’t fully build positions in one day. They accumulate over time. After a strong expansion leg, supply gets absorbed during consolidation while weak hands get shaken out.
Then eventually:
-volume contracts
-volatility tightens
-price respects the 21EMA
-demand starts stepping back in
That’s when the next leg higher can begin.
The key is understanding the difference between:
a healthy pullback into the 21EMA
vs.
Actual trend failure.
Don't be the person that chases trend extensions.. even the best stocks will eventually set back up for a move higher.
A lot of incredible opportunity on the leaders like:
$INTC
$NBIS
$ALAB
$AMD
In the coming weeks as they setup off the moving averages.
Mientras todos buscan la estrategia perfecta y persiguen entradas cada día…
hay 4 hábitos aburridos que los traders rentables repiten constantemente.
Y casi nadie les presta atención.
Pero ahí es donde realmente se construye el dinero.
Aquí están:
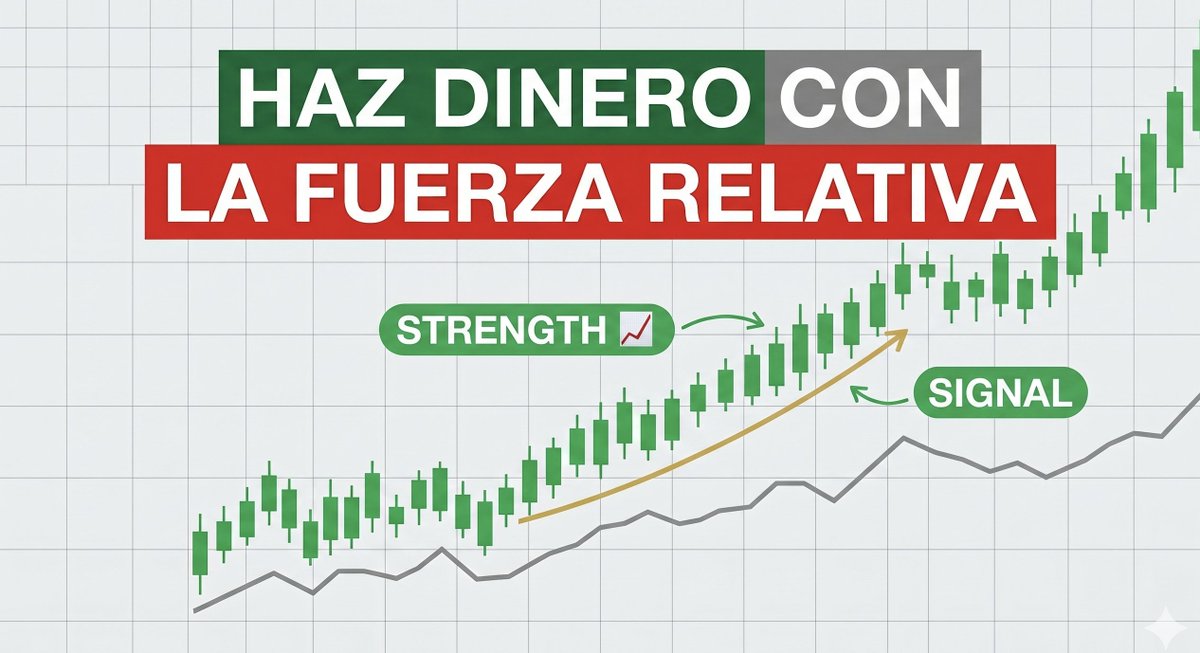
Cómo detectar fuerza relativa antes de los grandes movimientos.
La mayoría busca acciones que parecen baratas.
Los mejores traders buscan acciones que se niegan a caer.
Y ahí está una de las mayores ventajas del mercado:
la fuerza relativa.
Abro hilo👇🏻🧵
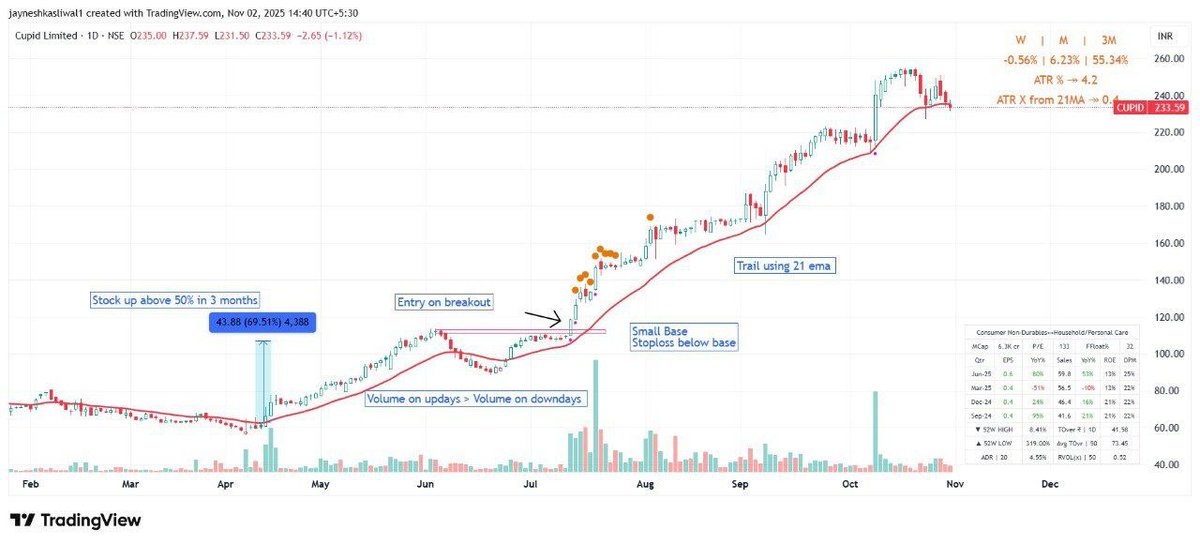
One of the Simplest and highest profitable Swing Trading Strategy:
Filter out stocks which have moved 50%+ in last 3-4 months
Wait for Small base formation with base < 10%
Enter on breakout with stoploss below base
Trail using 21 ema
Profit can be booked based on RR or TSL
6 Entry Types Every Swing Trader Should Know
1. PDH Entry
Price moves above the Previous Day’s High. It shows strength continuing from the last session.
2. Strong Start Entry
A stock opens well and shows clear strength and high volumes in the first few minutes. After the initial push, a break of any range formation could be used as an entry . Useful in leading stocks.
3. Pivot Break Entry
Price breaks a level that has been rejected multiple times. This suggests sellers at that level are finally out of the way. A clean breakout candle usually confirms it.
4. Anticipation Entry
Entering slightly before a breakout, usually inside a tight consolidation on a day where price has gone pretty tight, at EOD. The structure should already be strong so the breakout has a higher chance of happening. Gives better risk–reward.