We have our Data Talks on the Rocks series interviewing founders and creators of open source technologies, but now it’s time to dive deep with our users 🙌
In our first episode of our Data Driven Leaders series, we interview Kat Tomlin, Director of Business Operations at Disco.
So excited to announce the debut of Canvas dashboards! The Rill community will have more flexibility than ever before with how to visualize their metrics.
#dataviz#analytics#Rill
📢Introducing Canvas dashboards📢
Rill’s signature Explore dashboards have always had powerful slice & dice capabilities, but its layout was highly opinionated.
With Canvas, you control how metrics are presented - creating layouts that are purpose-built for your use cases.
Just published: Ever had to «Scale beyond Postgres»?
You may have started with a simple ETL pipeline and crunched critical business logic into useful dashboards, but speed and scale didn't grow with data at some point, and it's the concurrent user.
✨ Below are some highlights from the article.
@haro_ca_ @gavinxcrowley @RVrijj@RillData@streamlit@evidence_dev Just spent all weekend building @RillData cause I had never heard of it. Devastating for me but cool to see someone crushing it
I recently spoke at DuckCon #6 about how @RillData built an SQL-based metrics layer with @duckdb.
Why do metrics matter so much?
If every business can be distilled down to an equation (as @lennysan has written), the variables in that equation are metrics. MAU, ARPU, conversion, uptime, and revenue are what businesses live and die by.
Metric are intuitive yet flexible aggregates. Revenue is a sum of prices, but it can be evaluated in different contexts: "revenue for the US", "revenue by product category", "revenue by day this month", etc.
Metrics must be fast and explorable in real-time to be useful. If revenue is trending down, it could be because MAUs are off, because of uptime issues.
Making metrics fast and explorable at scale can be challenging, when they are being calculated on millions or billions of events.
DuckDB is an ideal engine for storing metrics, along with their dimensional attributes in OLAP cubes. These cubes are often 10-100x smaller than raw fact tables, but are a form of "loss-less" compression for metrics, enabling evaluation of metrics within any dimensional context.
If you're interested to learn more, check out the 20-minute talk and demo below.
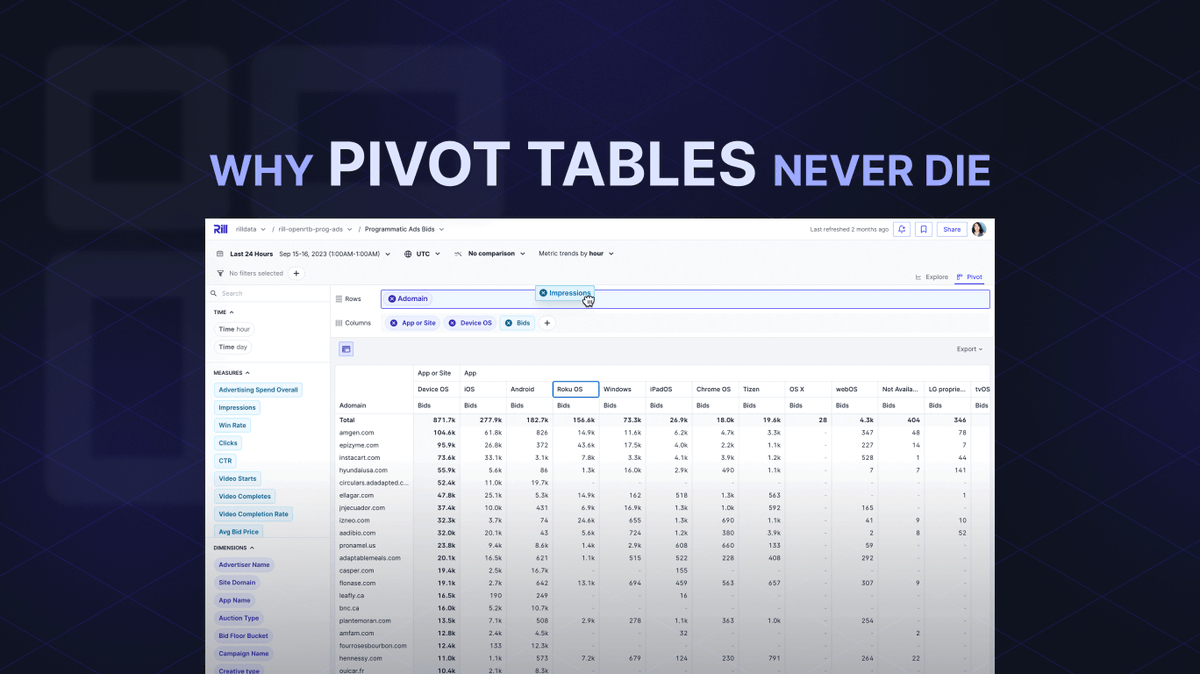
Low-latency user experiences make all the difference in data applications, especially BI dashboards. Gmail's creator made the 100ms rule, arguing that 600ms is too slow.
But why? Today's article (https://t.co/Usv653Enpx), in collaboration with @medriscoll, is about «Why Pivot Tables Never Die», answering these questions.
Rill is proud to sponsor DuckCon6.
@medriscoll will also talk about Rill's SQL-based metrics layer powered by @duckdb. Recognizing the wide popularity of SQL & DuckDB’s SQL dialect in particular, we developed a metrics layer that declares its metrics entirely w/ SQL expressions
2024 was a exciting year for Rill. We welcomed new team members, launched more features than we can count, and together with our customers solved interesting and challenging data problems.
@mindspank shares his top 5 features we shipped this year.
https://t.co/4R5zy5aiGK
Check out this @RillData dashboard with insights drawn from recent usage data from @bluesky ! Pretty cool how quickly @medriscoll was able to build this! https://t.co/7wD69wuTfL
This article describes how Rill uses AI prompts to generate dashboards, metrics, and improved data visualization. Generative business intelligence! Take a look :)
Imagine creating business dashboards by simply describing what you want to see - no more clicking through complex interfaces or writing SQL queries.
This is the promise of #GenBI, and I've just published an in-depth article exploring this newer domain.
👉🏻 https://t.co/08jYSm0LJ4
In the latest round of our Data Talks on the Rocks series @medriscoll interviews @hfmuehleisen, creator of @duckdb.
Here's a clip to see some of our favorite moments.
If you want to dive deep into database architecture, check out the hour long video. No AI talk in this one!!
Global collaboration, learning from everyone, and endless curiosity is our idea of a good time at Rill❤️
By tackling obstacles across the stack—from data transformation, to database architecture, and fast exploration—we help data teams become great data teams.
Come join us🚀
Data engineering is a huge source of technical debt for most companies.
Like physical plumbing, data pipelines are invisible. As long the data keeps flowing, no one cares if the entire infrastructure balances on an undocumented bash script.
No one cares until there's a problem. And then, suddenly, everyone cares.
The engineers who did the initial work are gone. The new VP of Engineering decides a massive overhaul is required to fix the rot. New data engineers come in, mutter "who made this unholy mess?", and begin ripping and replacing pipes.
Management wonders why it takes so much time and money to fix, while also saying it's now a mission critical priority.
There is a clear and present market for data engineering consultancies who will help guide businesses out of this mess. Vendors, tools, and data contracts are not enough. People and process are needed to build data engineering infrastructure that doesn't suck.
Businesses are learning the hard way that data engineering -- just like accounting, IT security, and DevOps -- is a first-class capability deserving of first-class investment.
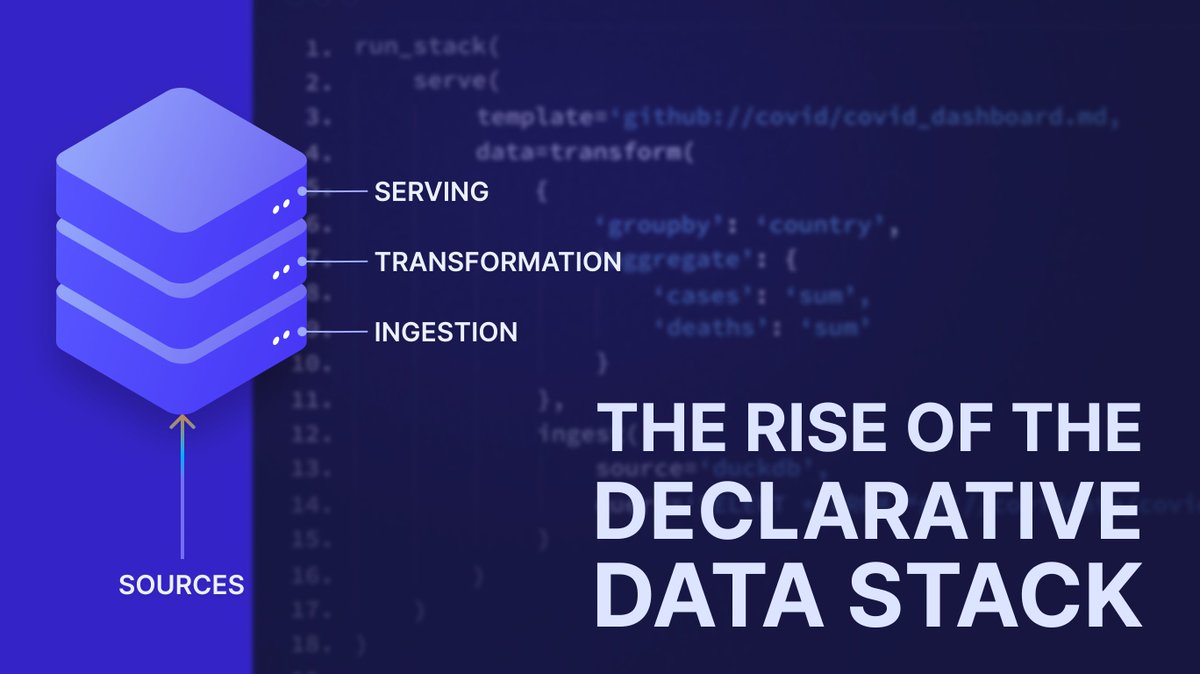
What if you could define an end-to-end data stack with a single function and run it with:
> run_stack(serve(transform(ingest)))
Would that be possible? It might, with a declarative data stack. Data stacks have come a long way, evolving from monolithic, one-fits-all systems like Oracle/SAP to today's modular open data stacks. This begs the question, what's next? Or why is the current not meeting our needs?
As we see more analytics engineering and software best practices, embracing codeful, Git-based, and more CLI-based workflows, the future looks more code-first. Beyond SQL transformations, across the entire data stack. From ingestion to transformation, orchestration, and measures in dashboards—all defined declaratively.
In this post (https://t.co/g7GXA8IRy4), we explore the history, what a declarative data stack is, why we would need it, and its connection to stateful assets. We even touch on Maslow's hierarchy for the declarative data stack.
AI-powered code for BI tools will be a game changer.
Create complex Vega specs with prompts, and populate their data with a simple SQL query.
(A teaser from something @mindspank is working on at @rilldata -- more coming soon.)
Check out the latest changes in the 0.48 release:
⭐️New Filter Bar - simply select the toggle to enable comparison view & set the custom range
⭐️Pivot from Timeseries - with 1 click, you can navigate directly to the pivot table from your timeseries graph
https://t.co/mtrclLETy2
Do you ever want to provide filtered access to a dashboard, maybe to a customer or partner?
With Rill .47, you can create a public link that takes any filters that were present at the point of creation & locks it down. You can add a expiration date too!
https://t.co/YMxihgydET