My Complete Gide of Educational Content is Open in one Publication! (link in my profile): Learn to navigate everything from technical indicators to macro studies with practical insights you won't find in a textbook.
$SPX $NDX $IWM $NVDA $AAPL $META $MSFT
$SPY: The price remains in a consolidation phase following Wednesday's doji candle. However, caution is warranted, as a bearish RSI divergence remains in play and the Stochastic indicator has generated a bearish crossover. The next trigger for a pullback would be a break below the 5-day moving average.
I'd say the main chart of the week is in tech. 150 likes💚 and 30 reposts🔁 to post the analysis. Or write "interested" below.
The Support and Resistance Levels for Next Week are Out! ➡️ They proved their worth during the week specially with $BRK.B, $UNH, $QQQ, $IBIT, and $NDX.
Access in my Bio. I insist, 100 likes💚20 reposts🔄for the tech chart before 8PM EST.
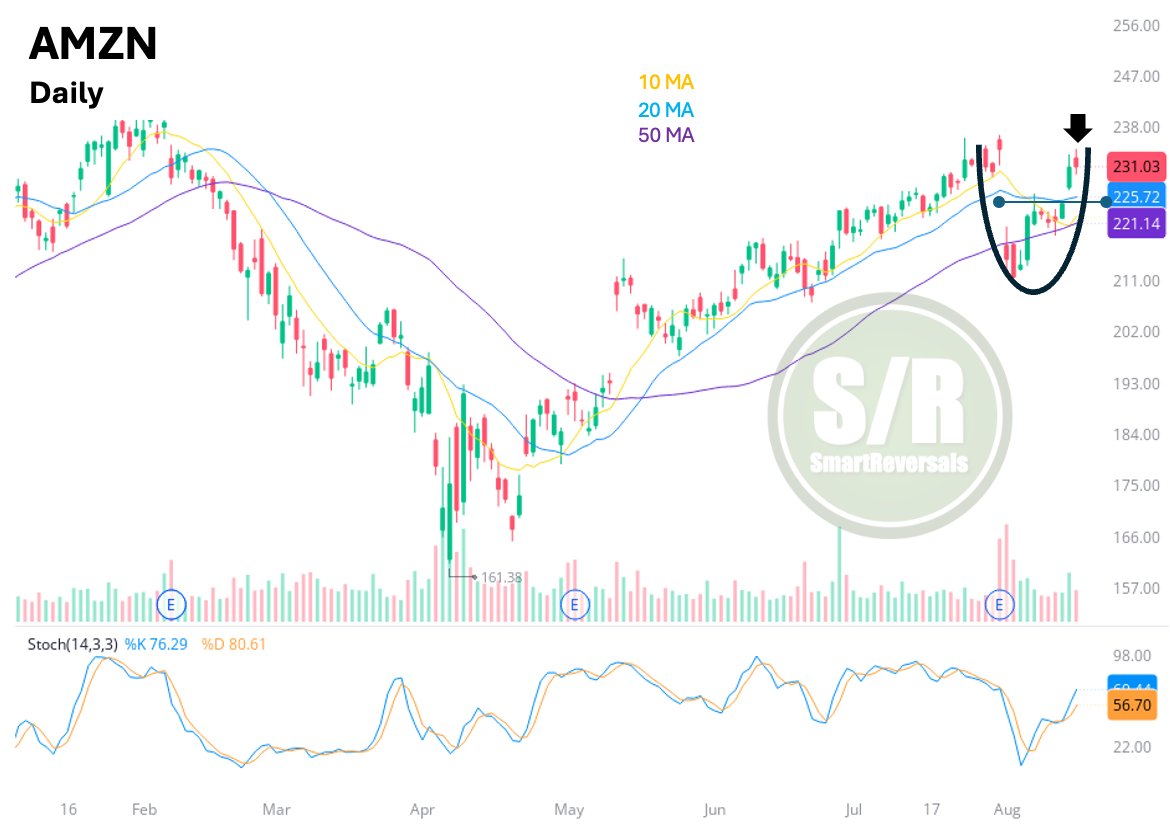
$AMZN has filled the $231.40 gap, but its price action is now showing signs of exhaustion after rallying +9% from its recent low and +3.75% this past week.
During the bounce, another gap was left open around $224.90. Even if the current bullish formation resembles a "cup and handle," a period of consolidation or a slight pullback is very likely before bullish continuation.
Tech chart will be posted, thanks for the likes.
$QQQ $NDX $SMH $AAPL $GOOG $NVDA
$SPX: Calling a technical or short lived bounce last weekend based on the oversold McClellan Oscillator was accurate. In previous cases the price has resumed the decline as the curved green arrows highlight. I will take disciplined notes if this time is different.
$AAPL was a key driver for the sustained bounce, the question is: Is it overbought already after a +13% weekly move?
150 likes and 20 reposts for the AAPL chart.
$NDX - The price has collided with its upper Bollinger Band. Recently, this event has resulted in a move down toward the 20-day moving average.
We will learn if this time is different, the candle suggests indecision.
$SPX Price Action Between Key Moving Averages: The 20DMA zone acted as support, and more specifically $6,292; an essential level for this week. Despite of the bearish candle, there was a bounce that once again stopped the move at the 10DMA.
The +0.73% gain is a positive sign, and tomorrow's trading session will be critical to see if bulls can sustain the momentum and break above the 10DMA, a feat that has not yet been achieved. The bullish Stochastic crossover provides further encouragement for bulls.
...the 10DMA has to be conquered.
The Latest Fundamental Update Is Out - Get access to the key updated factors to consider behind the charts for $MSFT, $GOOG, $META, and $AAPL.
Is there fuel for more upside? The answer is here.
How I would make my first $100K in profit If i had to start all over again. 👇
1. I would identify the highest probability setups that work 80% of the time and FOCUS on high liquidity, sector leading stocks.
2. I would work at least 1 other job to take pressure off making money solely from trading. Why put additional stress on yourself when you first start?
3. I would take 2-3 trade MAX per week. Quality is always better than quantity. More trades does not equal more profits.
4. I would practice being patience every single day to strengthen this muscle. Patience is the key differentiator between a success and unsuccessful trader. Mediation and mindfulness will help you become a better trader.
5. I would make realistic goals during the journey to 100k. I wouldn’t expect to make the 100k in 6 months. I would give myself 2 years to take the pressure of time off my shoulders.
6. Once I found my niche within the market, I would focus and repeat this process until it is well refined enough to replicate for years to come.
Trading is a lifelong journey. There will be thousands of opportunities to make money each year. It’s up to you to identify the best ones for you, your risk appetite, and your trading style. Go get it.
$TSLA - Consolidation Process in Play
The short term trend is intact from the 5DMA perspective, and there is a potential bearish divergence with the RSI. This looks as a healthy consolidation.
Get access to a comprehensive fundamental analysis for Tesla, Ferrari and General Motors through the link in my profile⬆️. If the market is to pullback, the context behind the charts help to make better decisions.
$SPY $QQQ
$NVDA - The initial reaction to Earnings Report is Bearish, there is a bearish MACD cross so a pullback is likely.
However: Nvidia beat expectations for sales and earnings, while delivering a better-than-expected forecast for the current quarter. Revenue is rising 94% YoY.
Fundamentals are key, and they will be analyzed in the next edition.
$MSFT - Reversal at the Bollinger Band:
Even before ER, price came back to earth when the bearish candle moved to the Bollinger zone, and further continuation will occur tomorrow.
The yellow area and blue arrow highlight the most likely gap, breaching the 20 moving average. This stock usually fills gaps😉, but waiting for candle formation and oscillators by the close tomorrow is prudent.
$BTC - The moves between Bollinger bands that have been seen during the last months have found support this time at the 20 daily average, which is good!
Anyway, price broke above the higher band again, a consolidation is expected, at least to the 20DMA again.
#Bitcoin#SPY $GOOG #Crypto
$SPX - Once again the 20DMA is tested, 6 days in a row on the edge. The candle is bearish, and as of 4:20PM the reaction to $MSFT earnings slightly positive but not as explosive as with $TSLA or $GOOG, so technically speaking the cautionary mode is key. Buying here is risky. Fast oscillators are halfway to oversold levels, a potential pullback will be oversold relatively quickly.
Shooting Stars Across the Board
$MSFT, $AAPL, $AMZN, $META, and $NVDA closed with a shooting star or gravestone candle on Friday, it is usually bearish considering the gap below those candles.
The first two have been charted already here, and Nvidia doesn't present ER, so Amazon and Meta have a setup that suggest a pullback starting the week, good for Amazon that reports on Thursday, not so good for Meta to head into ER earlier in the week with a bearish setup.
Interestingly, Google is bouncing after months of weakness, looks like risk/reward favors longs in Google, always managing risk.
Have the higher Bollinger band or the 20DMA initiated a pullback for MSFT, AAPL, META and AMZN? Will Google prove true its bullish setup?
$ES_F $NQ_F #Stocks
$TSLA - Technicals were screaming this rally, as posted since the beginning of the week🎯🎯🎯. Significant pullbacks have occurred when the higher Bollinger band has been reached, that is not the case as of today, and the candles show conviction with volume validation.
Double gap: Be mindful about it, yes, there is a gap in April 2024, July 2020, and a big one in October 2019.
This one is double, for sure something to study in the middle and long term.
For now, enjoy the ride and manage risk (see the support levels for next week👇, short timeframes are getting hot, suggesting healthy consolidation, before breaking the higher band? What do you think?.
$QQQ $NDX $SPY
$IWM - The decline from the higher Bollinger band was anticipated since last week🎯🎯🎯. Today, there is potential support at the 50DMA considering its confluence with the volume shelf, but the oscillator says the move is not complete, as it indicated in previous events highlighted with green circles.
The most important elements is to avoid a fall below the volume shelf, rapid moves happen between shelves, see the rapid moves when price has moved in the area highlighted by the red arrow. Risk management is key.
$SPY $DIA #Stocks $VIX
$NFLX - Retrace When the Bollinger Band is Breached
A reversal is better timed when there is a bearish crossover in the Stochastic as highlighted with arrows, and the latest bearish candle suggest the decline is not over.
The recent breakout and Earnings Report suggest that a pullback is a buying opportunity, a bullish reversal lately has been seen at the 20DMA or lower Bollinger band.
$QQQ $NDX $SPY
$MSFT - Gravestone candle clashing with the higher Bollinger band, and the oscillator is printing a bearish crossover. Those conditions usually bring pullbacks as highlighted.
The complete analysis for #Microsoft with key levels to watch is included in the latest Weekly Compass, get access in profile/link ⤴️
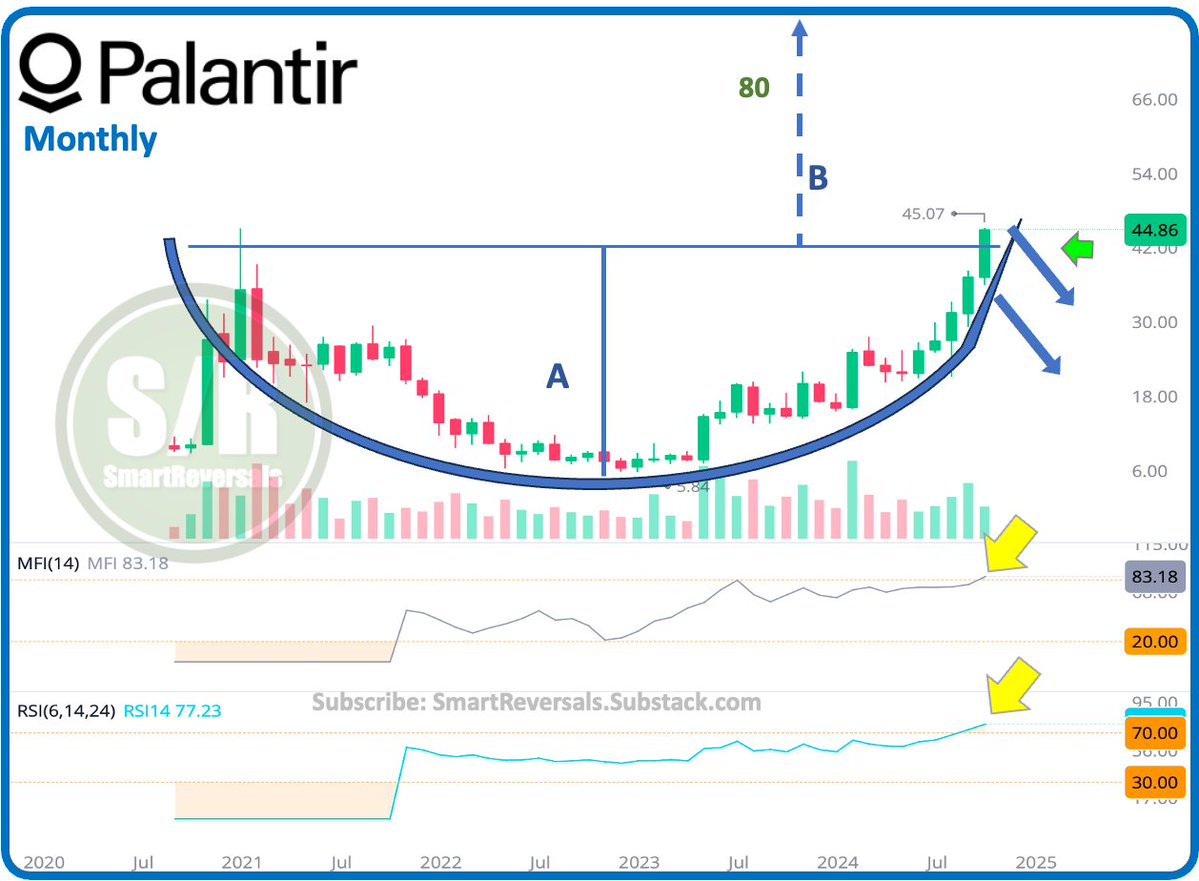
$PLTR - Cup with Handle in the Making
The cup and handle is a bullish chart pattern that suggests continuation of an existing uptrend. It includes:
The Cup: The price forms a "U" shape, indicating a period of consolidation or accumulation.
The Handle: The price then retraces slightly, forming a handle-like shape. The handle should be shorter than the cup and have lower trading volume.
The Breakout: A bullish breakout occurs when the price breaks above the resistance level formed by the top of the cup and handle.
Trading the Cup and Handle Pattern:
Buy Signal: A buy signal is triggered when the price breaks above the resistance level of the handle.
Stop-Loss: A stop-loss order can be placed below the support level of the handle.
Profit Target: A profit target can be set based on the height of the cup, in this case $80.
The Monthly RSI and MFI for Palantir presents overbought levels, building on the thesis that a pullback or the handle is brewing.
Not all cup and handle patterns will lead to successful trades, so it's important to manage risk.
$QQQ $NDX #SP500 #Stocks #Trading