A conversation with @patrickc on old programming languages, software at industrial scale, and AI's effect on economics/biology/Patrick's daily life.
00:15 - Why Patrick wrote his first startup in Smalltalk
03:35 - LISP chatbots
06:09 - Good ideas from esoteric programming languages
09:12 - Brett Victor and Dynamicland
16:37 - Programming human organizations
20:28 - A codebase's "Big Bang" moment and MongoDB
25:49 - Rewriting Stripe
32:00 - How do you, Patrick Collison, use AI?
38:25 - Changes to GDP/TFP
41:56 - Programming human biology
46:10 - Unexpected beneficiaries of AI
In Rob Gronkowski's first season on FOX, the crew tricked him into believing there was a #Cowboys TE named Rich Russo, who had two fingers missing.
Then they had to talk about it and Gronk just made up some stuff.
This prank is awesome 😂😂
You'll never see Bill Belichick happier than you will at the end of this video 😄
Belichick was asked by a reporter why do teams hold a Long Snapper instead of using a position player and saving a roster spot.
Bill answered him.. for 10 straight minutes
The way Datadog calculates percentiles at scale is very innovative 🔥
Usually, calculating the percentiles of large datasets is very expensive.
To know the 99th percentile of a stream of values, you need to:
- keep all the values
- sort them
- return the value whose rank matches the percentile (e.g 99th item)
Datadog cannot afford to do this with the many millions of data points that come in every second - the space and CPU requirements are not practical for a company with thousands of customers. 🐾
Naturally, they opted for sketch algorithms - those should provide them with a good-enough probabilistic result while being vastly more efficient to compute.
Unfortunately - they couldn’t get satisfactory results.
The algorithms would produce results that were too inaccurate. ❌
Why?
Many percentile sketches had guarantees in terms of *rank error*.
A rank-error guarantee of 2% means that the p95 value returned by the sketch is somewhere between the p93-p97 value.
But system latencies exhibit very fat tails - the difference between the p97 and p99 values can be 2-10x!
So what did the dogs do? 🐶
They invented a new sketch algorithm - DDSketch.
Instead of rank error guarantees, they designed it for *relative error* guarantees.
If the p99 is 60s, a 2% error means the sketch would return 58.8-61.2s.
The algorithm is surprisingly pretty simple:
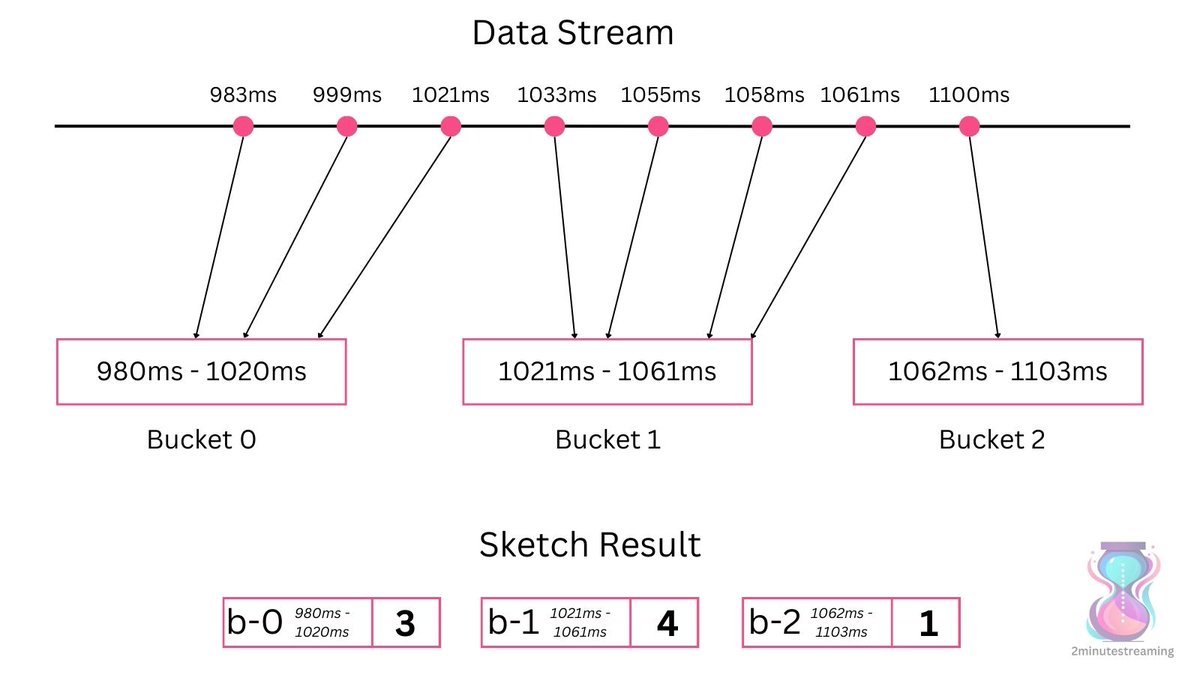
• They create buckets covering ranges of the desired error rate. (+- 2% in this case) 🪣
• Each bucket keeps a counter of the amount of data points within that range. 💯
• When processing an item (latency metric data point), increment the counter of the appropriate bucket. ➕
• To count the desired percentile, you sum up the bucket’s values until you get to the desired percentile. Whatever bucket that percentile is in - that’s your value. 🏆
In this example, the 50th percentile is 1033ms. (4th value out of our total of 8)
Going by count, the 4th value is in the second bucket (b-1) and the algorithm would produce a result of 1021-1061ms.
To cover the range from 1 millisecond to 1 minute, you only need 275 buckets.
With 64-bit counters, that's just ~2kB of memory, regardless of the amount of input data.
This is why we call sketch algorithms sublinear in space growth - memory requirements do NOT grow linearly with input.
The exponential nature of the bucket distribution makes it cheap to cover an even wider range: 1 nanosecond to 1 day takes just 3x more buckets:
• 802 buckets at ~6kB.
As you can probably tell, this is pretty easy to parallelize.
You can divide this bucket-building exercise into many parallel lightweight substreams, and then merge the results freely. 🕊
The merge operation is a simple sum of the buckets & their counters, which ensures that the accuracy is kept in the same range.
It is a very scalable and performant sketch algorithm.
Kudos to Datadog for inventing it.
Good boy! 🫳🐕🦺