This Radiologist said :
"If I have cancer, I won’t go to the hospital. I’ve seen too many people die from chemo, not from cancer."
1. I’ll fast for 30 days and I’ll stop working.
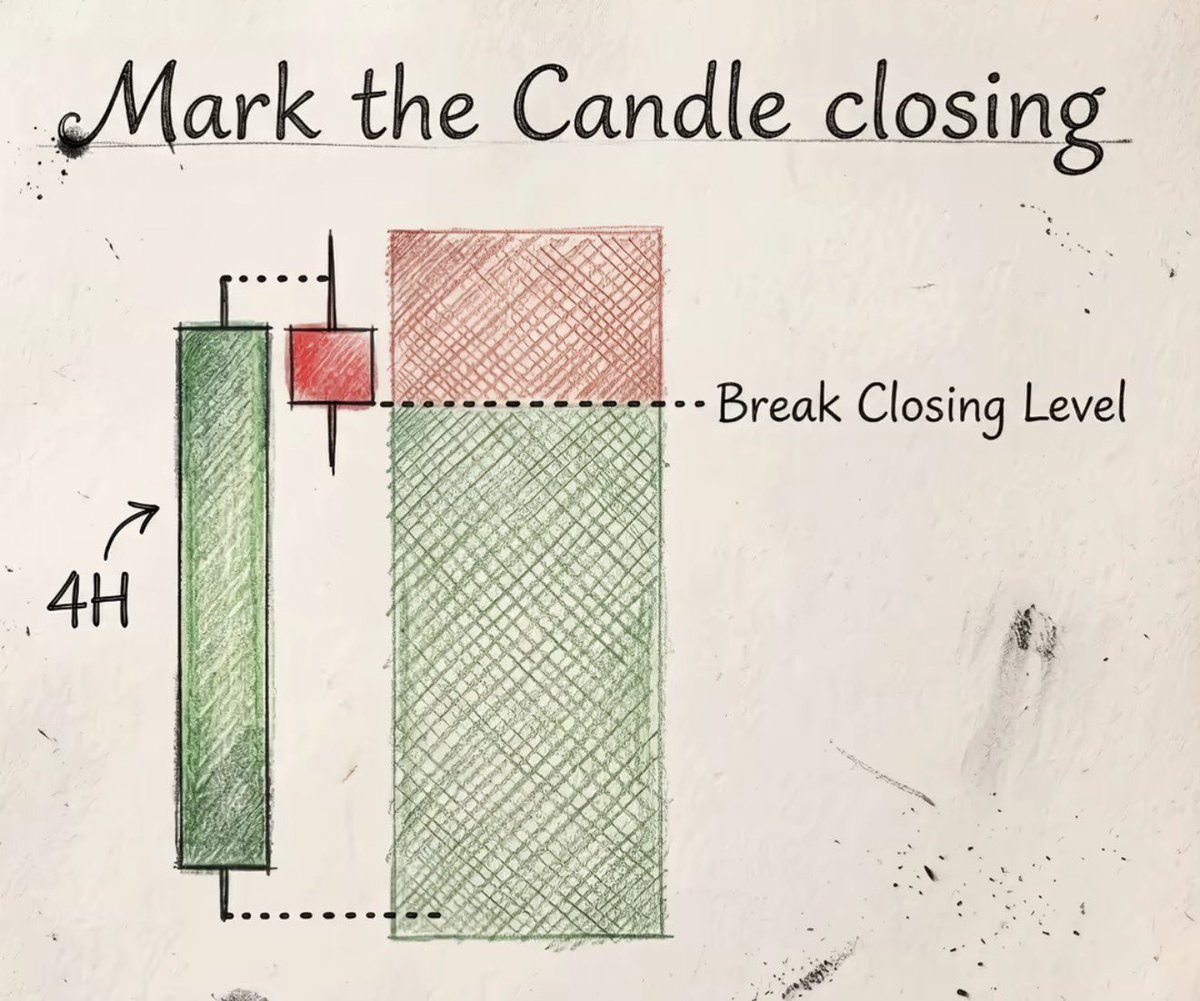
Step 1: Identify the reference candle
The large green 4H candle is your reference candle.
Its high becomes the level you’re watching.
Instead of reacting the moment price trades above that high with a wick, you wait for a candle to close.
Step 2: Mark the closing level
The dotted line labeled “Break Closing Level” is actually the closing price of the bullish candle, not its highest wick.
The idea is:
High (wick) = liquidity area.
Close = where buyers actually proved they were in control.
Step 3: Wait for confirmation
The small red candle wicked above the previous high but closed below the previous candle’s closing level.
That tells you:
Buyers tested above.
They couldn’t sustain the move.
No confirmed break yet.
Many traders would wrongly call this a breakout because they only looked at the wick.
Why the closing level matters
A candle wick only shows that price visited an area.
A candle close shows where the market accepted value.
Professional traders often care much more about where candles close than where they wick.
Williams %R Trading Strategy – 81% Win Rate – Williams Percent Range vs RSI (Backtest, Indicator & Systems)
Williams %R does work. In this post, we explain how to use Williams %R in a trading strategy, and finally, we backtest trading strategies to see if Williams %R works. Does it work? Our conclusion is that Williams %R seems to work pretty well.
We backtest the Williams %R trading strategy on the S&P 500 (SPY) and we make the following trading rules:
Entry is at the close when the Williams %R is below -90 and exit, when we sell, is when today's close is higher than yesterday's high or when the Williams %R closes above -30.
By using optimization we get, perhaps as expected, the best results on short lookback periods. We used a minimum lookback period of two days and a maximum of 25 days. All tests gave a profit factor of two or more, except for 25 days which produced 1.9.
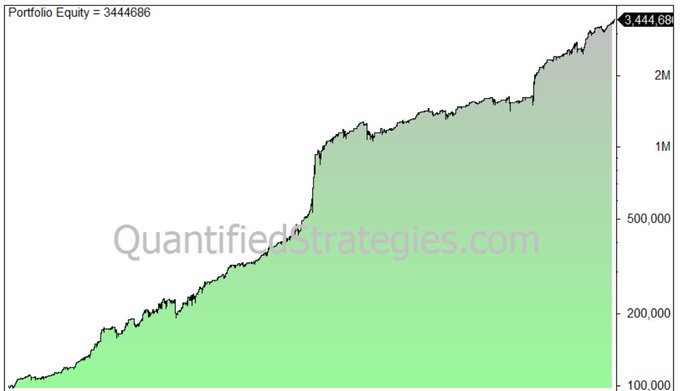
The best result is a two-day lookback period. This gives the equity curve (Shown below) for SPY since its inception until today.
Can the strategy be improved or made different? If you have any suggestions, please comment 👇
#TradingStrategies
Master this strategy then unfollow every trader:
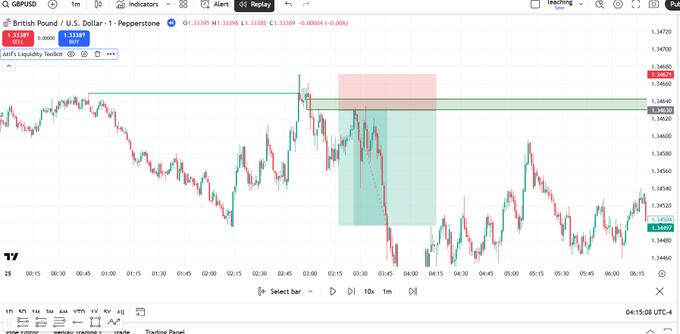
1. 4H direction. Bullish, bearish, or no trade.
2. Mark equal highs and equal lows.
3. Note unfilled FVGs.
4. Wait for the sweep.
5. 15M FVG confirmation.
6. SL set. TP set. Walk away.
No exceptions.
I won't lie to you.
Liquidity is hard.
But this indicator does it all for you.
It plots sweeps.
It identifies Liquidity.
It gives you signals.
And it send alerts.
You don't have to be at the charts all day.
The developers have added AI to this indicator which has exploded the win rate.
The AI will show you only the best setups in the market.
Major update coming sometime in August.
The CEO will raise the price when the update goes live.
If you can, I would highly suggest getting lifetime access before the update drops in August:
https://t.co/awnOGrODjm
The famous 5 EMA Intraday Selling by Mr. Subhasis Pani — Learn in 3 Minutes.
Steps
1] Timeframe: 5 min chart
2] Add 5 EMA indicator
3] Find Alert Candle — a candle whose low doesn't touch the 5 EMA
4] Entry — next candle breaks low of Alert Candle
5] SL — high of Alert Candle (cap ₹7-10k/lot; too wide? switch to cash)
Rules
1] Entry only within 10 AM
2] Re-entry (stocks) — once only, within 10 AM
3] Re-entry (index) — allowed all day
4] Take 5 trades/day
5] Target — 1:3 R:R
❤️
@AshramEstore कृपया दूर दराज के छेत्रों में जहाँ सामग्री सेवा केंद्र उपलब्ध नही हैं तो कृपया ऐसे छेत्रों में डिलिवरी शुल्क 1000र से अधिक के आर्डर पर नही लिया जाए
हरि ॐ