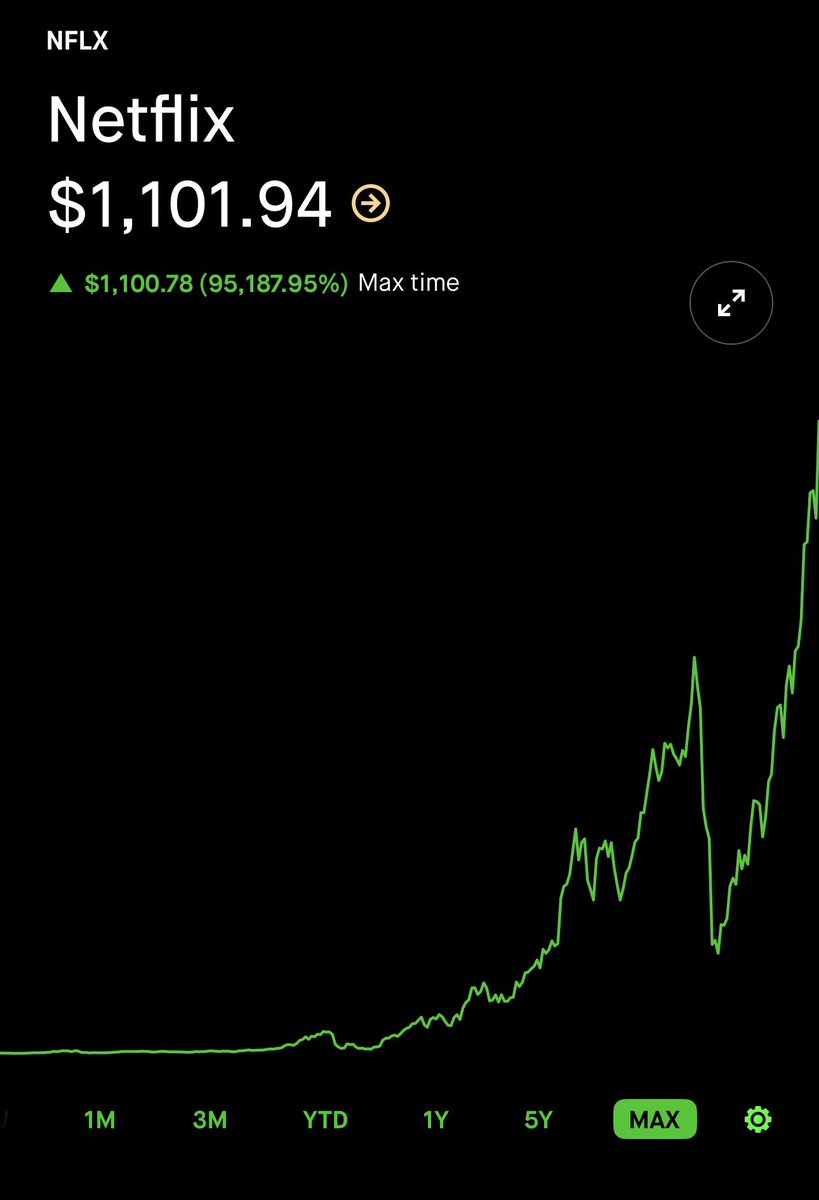
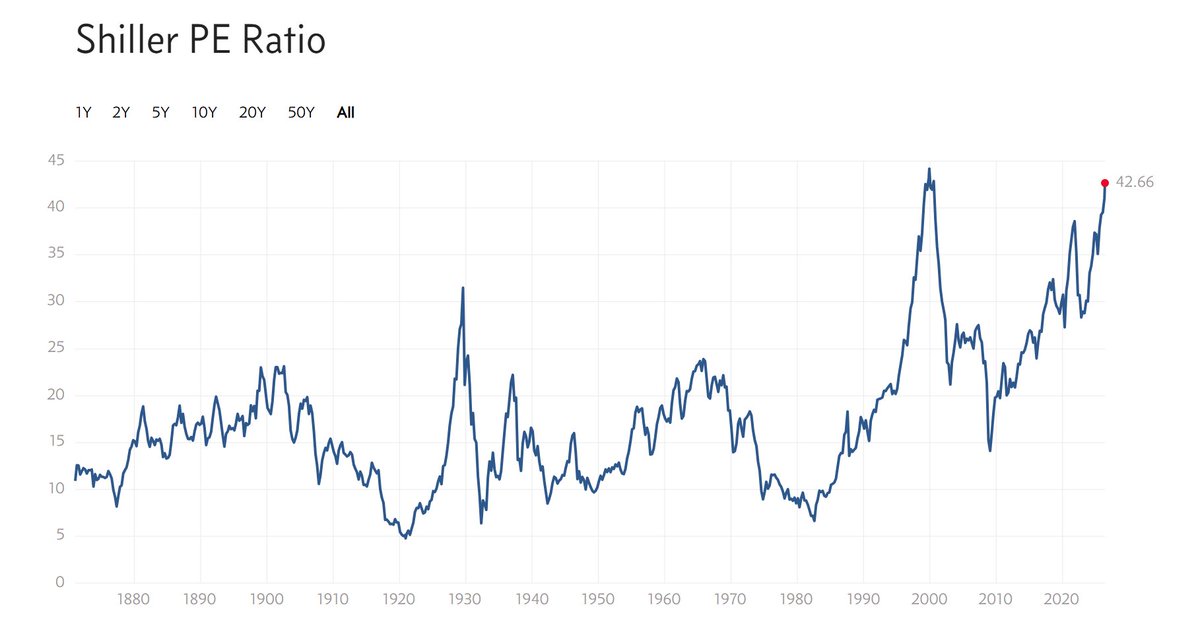
It’s Cathie’s kinda market out here
Who remembers 2017?
How about 2020-21?
I think we’re going back and this chart is a big reason why 👇
$ARKK
https://t.co/yFXNdLaI6P
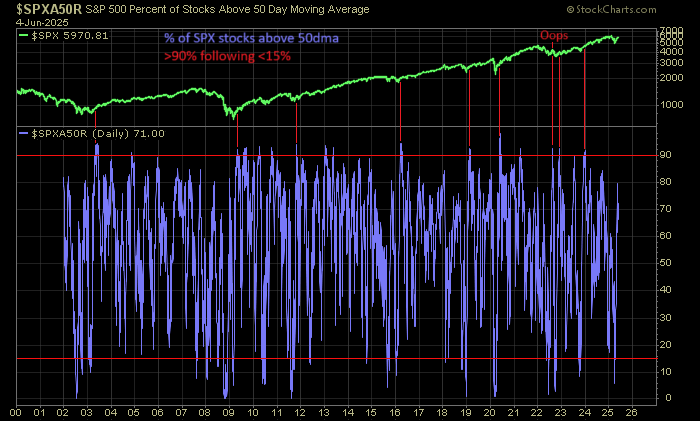
Was April 7th a cyclical bottom? One confirmation still missing is 50-day breadth momentum >90% following <15%. Comment: This signal typically occurs within 50 days of the final <15% reading. Yesterday was day 37.
@allstarcharts Last time $GOLD broke a multi decade monthly momentum structure like this in the year 2000 it went on a 12 yr run relative to the S&P500. After 16yrs $GOLD now appears once again set to for sustained relative outperformance vs the S&P500
Nike $NKE is a stock that has been beaten down big time that I am now watching.
$173 to $74.
Companies (and stocks) such as this usually turn it around, eventually.
There's no rush as there's still time for it to base and show some life. Still in a stage 4.
Be patient!
There have been two times in the past 40 years when the S&P 500 rose for 7 straight days following a 100-day low.
The first was on March 20, 2003. It marked the end of that bear market.
The other was today.
Zweig Breadth Thrust indicator fired on Friday. This represents a sudden and swift improvement in breadth conditions after they have been beaten down. Check the last ten years and you'll see this hits rarely, and is usually pretty bullish. Big exception in 2015-16! $SPX $SPY