@CarrieCnh12@causalitybrunch@buildwithbob This is what low IQ types who have nothing cerebral to contribute to a discussion say. Are you aware of that as you're typing out this drivel?
Friday’s pullback in US equities offers a chance to add exposure rather than a reason to retreat, with a path for the S&P 500 to reach 8,000 this year, according to John Flood, the head of Americas equities execution services at Goldman https://t.co/12K9Amob4i
The US, Mexico and Canada are set to blow past a July 1 milestone to renew their trade deal, opening the possibility of years of haggling over tariffs for auto manufacturing and other industries, people familiar with the matter said https://t.co/kXcbEgL7tp
This chart is more important
Token usage (blue bars) is exploding higher. It started in January when Agentic AI went mainstream with Claude Cowork and Moltbook (OpenClaw).
AI users are creating agents and code, leading to exponential growth in AI usage.
It's just starting.
‼️US consumers have almost never been this BULLISH:
In May, 54.8% of Americans said stock prices will be higher in the next 12 months, the 2nd-largest share on record.
This is only below the brief peak of ~57% recorded in 2024.
To put this into perspective, during the 2022 bear market, the share was just 25%, while during the Great Financial Crisis even below 20%.
Sentiment euphoria is almost in every corner of the market.
Last week, Michael Harnett of BofA included this chart in his May 22 "Flow Show."
As this reposted thread below details, we have not seen the market this concentrated around a single theme in 150 years.
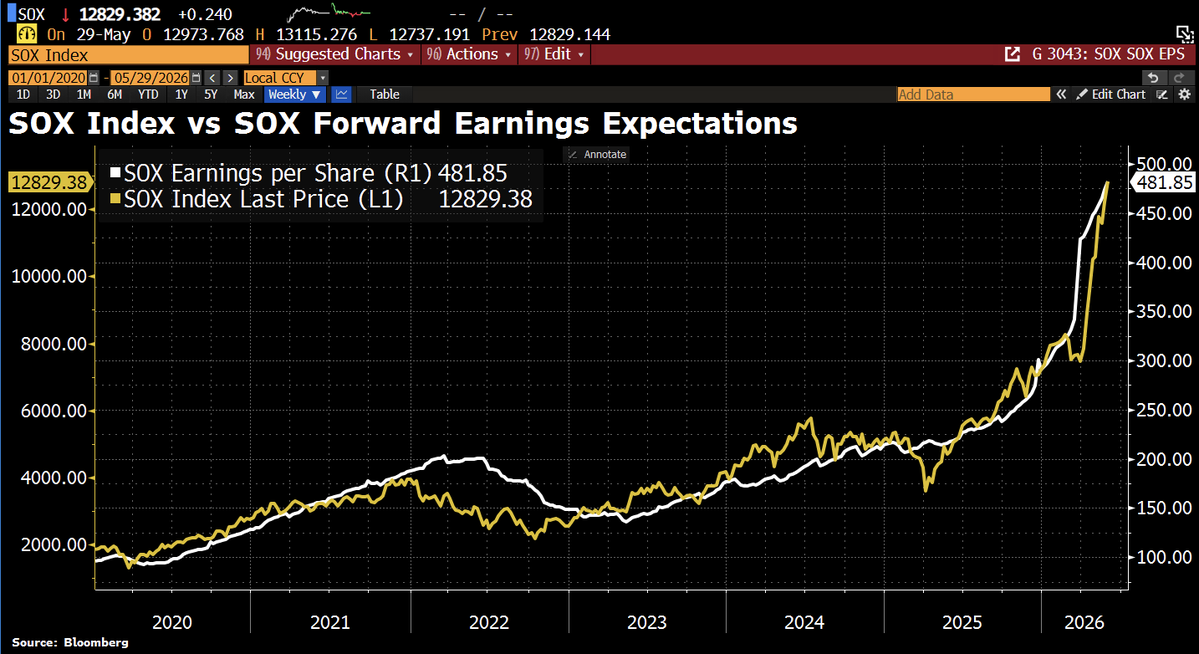
One of the most striking charts out there: the SOX index has risen sixfold since 2020, while SOX earnings per share have climbed fivefold. In other words, most of the rally has been backed by real earnings growth, not just higher valuations. The key question now is whether these profits will actually come through and whether they can keep rising. (HT Goldman Sachs)
🚨HOLY COW:
US margin debt SPIKED $83 BILLION in April, to $1.3 TRILLION, an all-time high.
Leveraged borrowing has soared $453 billion, or +53%, over the last year alone.
Margin debt now reflects 5.2% of US GDP, also an all-time record.
This exceeds any other bubble peak and the meme stock frenzy in 2021.
There has never been so much leverage in the stock market.
‼️Big Tech cash is disappearing at a RAPID PACE:
Combined free cash flow across Microsoft, Alphabet, Amazon, Meta, and Oracle is projected to FALL more than -70%, to ~$100 billion, by the end of 2026.
This figure peaked at ~$250 billion in early 2024, even as trailing net income continues surging toward a record ~$450 billion.
This comes as AI capital expenditure is consuming nearly every dollar, with the combined 2026 CapEx expected to surpass $715 billion.
In simple terms, these companies are reporting record profits on paper while simultaneously running out of actual cash, forcing them to issue a projected $175 billion in new debt in 2026 alone, more than 6 times the pre-AI cycle average, according to BofA.
When earnings and cash flow move in opposite directions this aggressively, equity valuations built on earnings alone become extremely fragile.
BofA on the consumer after spending plunge last week:
"We also see a risk that surging gas prices might finally be taking their toll, especially as the tax refund tailwind fades."
Two gauges of US inflation, CPI & PCE, have diverged meaningfully. The reason: Price spikes in products tied to the AI infrastructure buildout. "AI infrastructure demand plus energy-related supply constraints tied to the Iran conflict could make inflation more persistent:" Pimco