Murararitswe!
Tubararikiye kuzakurikira ikiganiro #WaramutseRwanda kuri Televiziyo Rwanda ejo ku wa 7/07/2026 guhera saa 7:00, kizagaruka ku mikorere ya Sitasiyo y’igenzura ry’Ikirere cyo hejuru #UpperAirStation n’akamaro k’ibipimo byayo mu kunoza serivise z’ubumenyi bw’ikirere
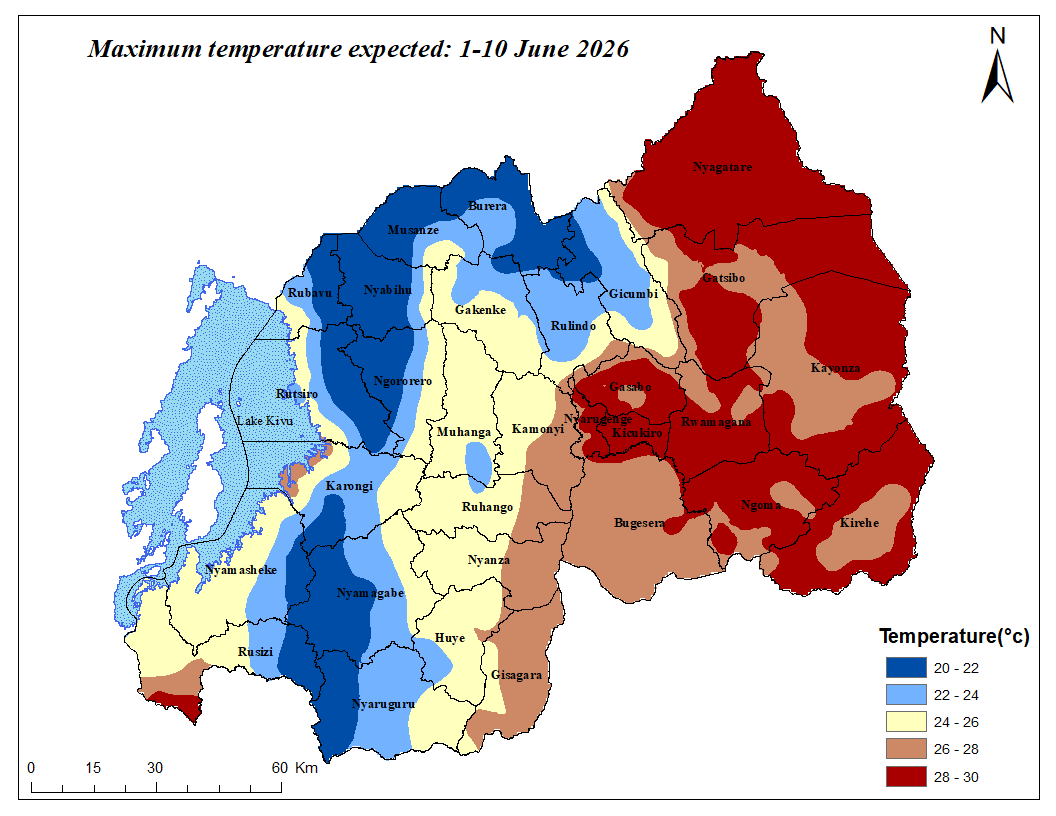
DEKADAL WEATHER FORECAST
🗓️10-10 June 2026
Rainfall ranging between 10-60 mm is predicted across the country, which will be slightly above the Long-Term Mean (LTM) range.
The daytime maximum temperature will range from 20°C to 30°C
➡️https://t.co/T3TyU1rDHL
The four moments in statistics — mean, variance, skewness, and kurtosis — are essential for understanding the shape and behavior of data distributions. Each moment provides unique insights that help us analyze and interpret data more effectively.
Understanding the Four Moments:
1️⃣ Mean: The average value, indicating the central tendency of the data.
2️⃣ Variance: Measures the spread of the data around the mean, showing how dispersed the data points are.
3️⃣ Skewness: Indicates the asymmetry of the data distribution. Positive skewness means a longer tail on the right, while negative skewness means a longer tail on the left.
4️⃣ Kurtosis: Describes the "tailedness" of a data distribution. High kurtosis results from a combination of mass (the probability of extreme values) and distance (how far those values are from the mean).
Mastering these moments:
✔️ Enables a deeper understanding of data, beyond just the average or spread.
✔️ Helps in identifying and addressing skewed distributions and outliers.
✔️ Improves the robustness of statistical models by considering all aspects of distribution shape.
Neglecting these moments:
❌ May lead to incorrect conclusions, especially if the data is asymmetrical or has extreme values.
❌ Can result in poor model performance due to unaddressed variability or irregularities.
❌ Limits the ability to accurately compare different data sets, leading to biased results.
The visualization shown illustrates how different distributions vary in terms of mean, variance, skewness, and kurtosis, based on data generated in R using ggplot2. Each curve represents a different distribution with distinct characteristics, allowing us to observe how changes in these four moments affect the shape and spread of the data.
If you're eager to learn more about this and related topics, check out my online course on Statistical Methods in R. See this link for additional information: https://t.co/7YQCRDKSPO
#datascienceenthusiast #Statistics #RStats #Python #rstudioglobal