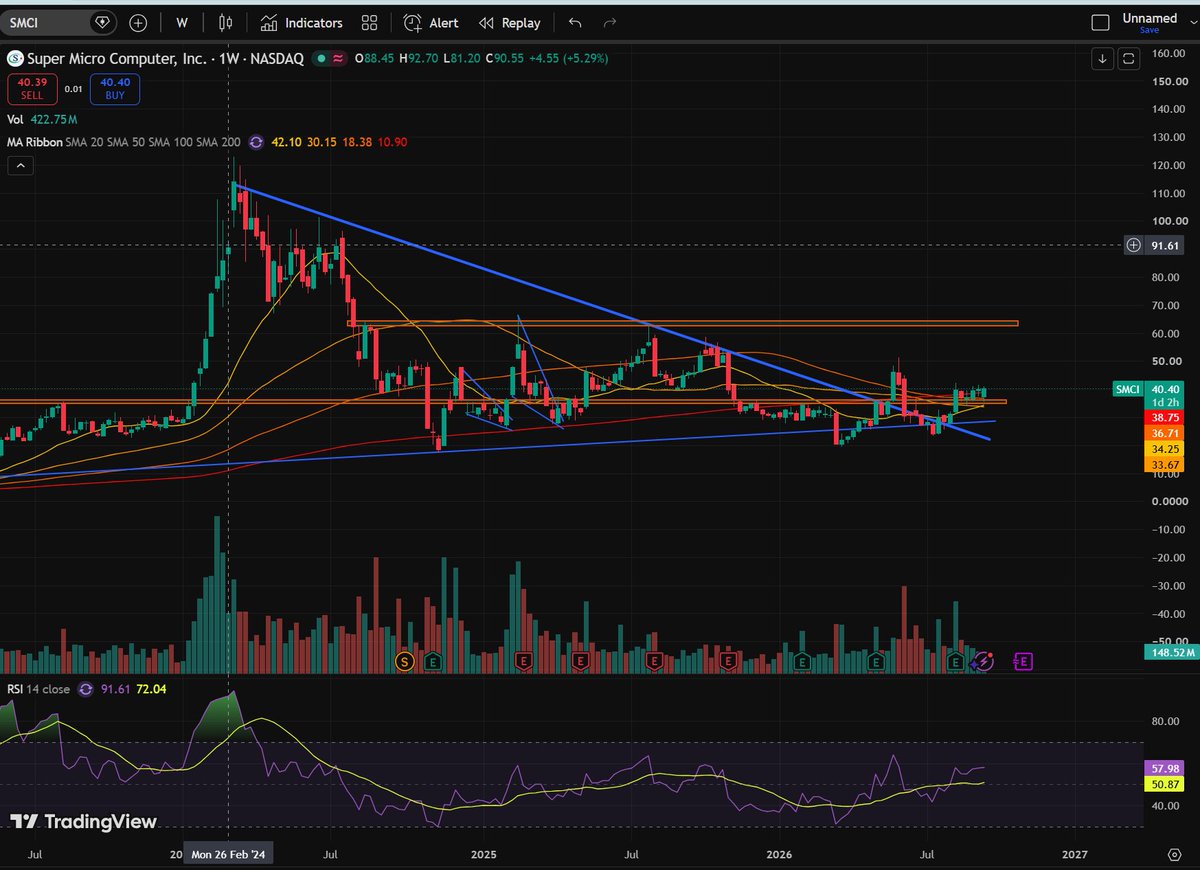
$SMCI looking real clean on the weekly chart!
Broke multi-year downtrend line
Consolidating above key Moving Averages
Support zone holding strong (~$36-$38)
Weekly RSI curling up into bullish territory
Ready for a move towards the $50-$65 resistance zone? 👀