I don't have a course to sell you and I'm not posting $BTC to $250k every day until it happens.
I do think this cycle ends higher. The market makers just pump it to wipe out the shorts and dump it to wipe out the longs on the way there, and most people only work that out once it's happened to them.
Bull, not blind.
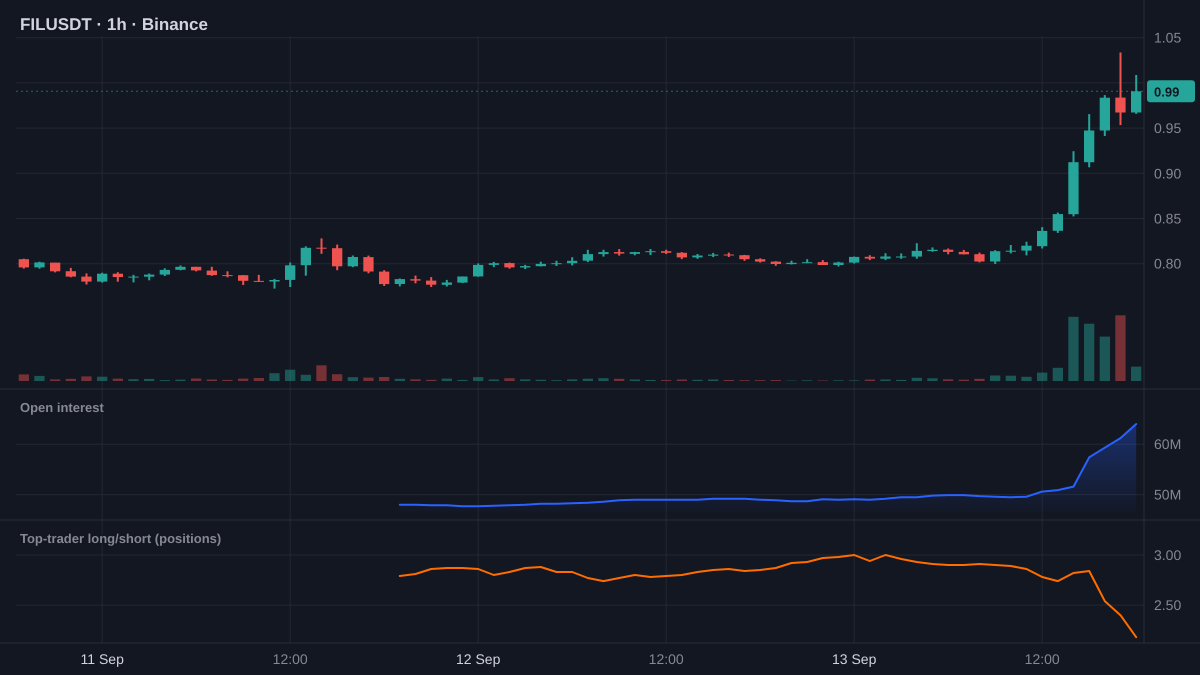
FIL ran 26% in five hours on a dead Sunday.
Open interest climbed from $51M to $64M as it went. Fresh longs, chasing.
Binance top traders sold into all of it: long-to-short from 2.8 to 2.2 in three hours.
Who bought the top?
1h chart, Binance.
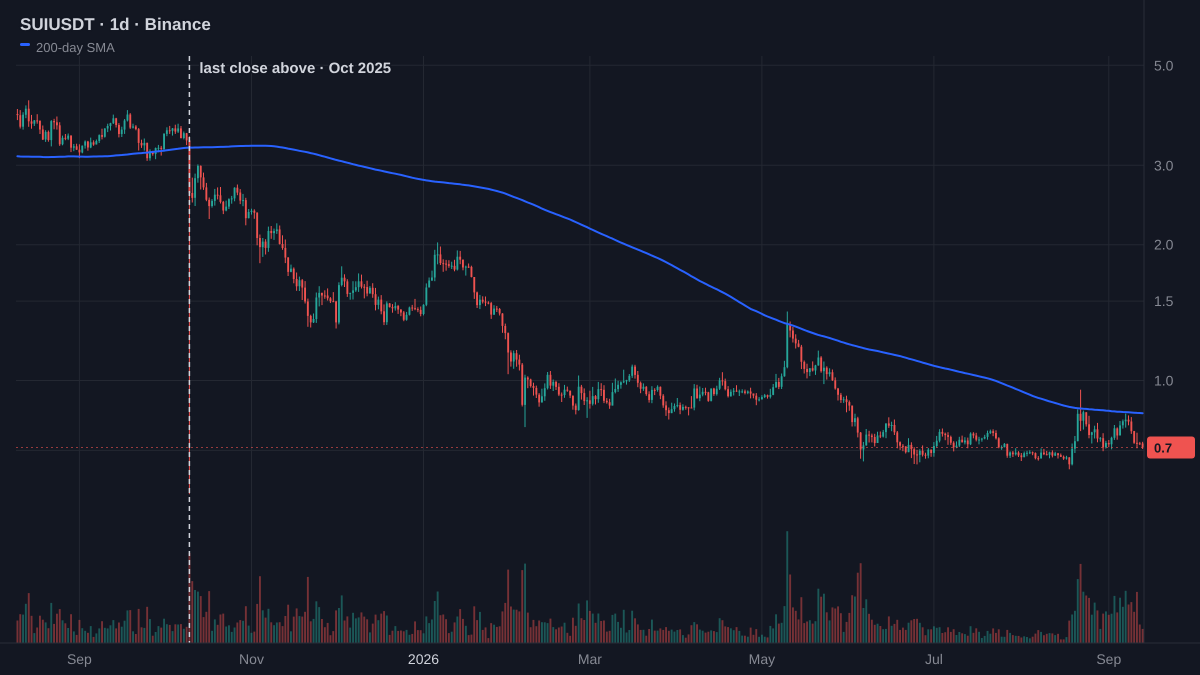
SUI hasn't closed above its 200-day average in 339 days.
The previous longest run was 138.
And the longs are finally leaving. $31M liquidated in 24 hours, a fifth of the long side, and top traders just cut to even with the crowd.
Who's left to sell?
1d chart, Binance.
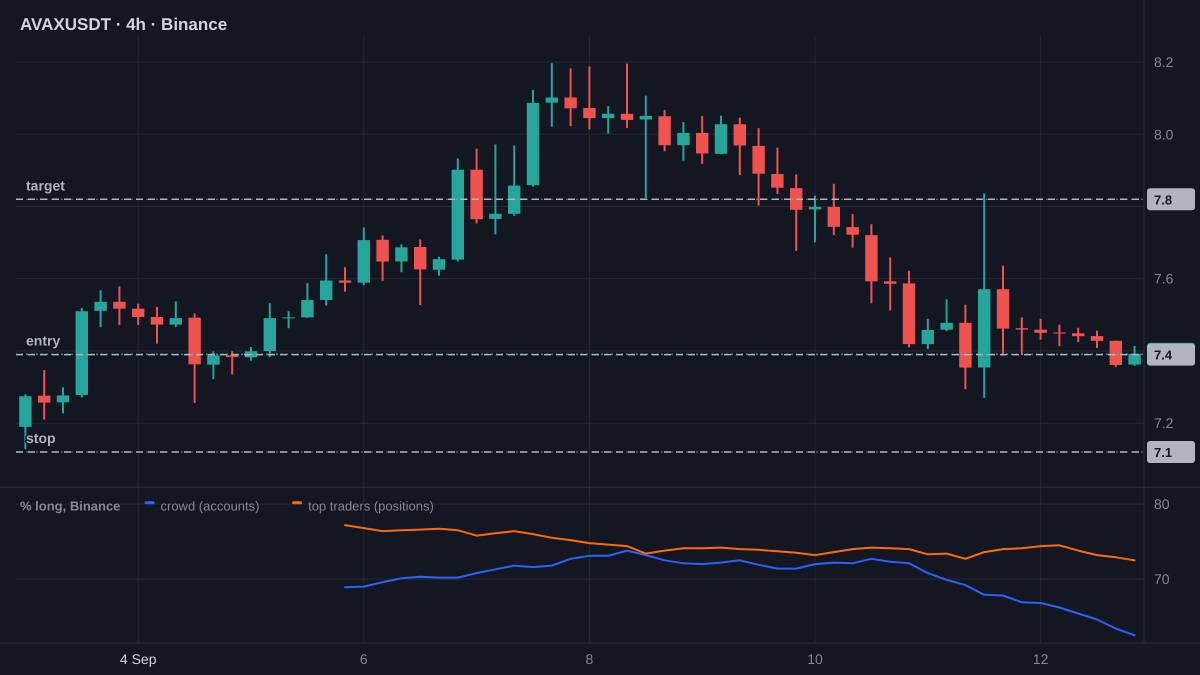
AVAX fell 10% in five days and the crowd walked. The desks didn't.
Long at $7.39. Stop $7.12. Target $7.82.
Top traders are 10 points more long than retail, wider than 98% of the past year. $7.27 held twice.
Side with the desks.
4h chart, Binance.
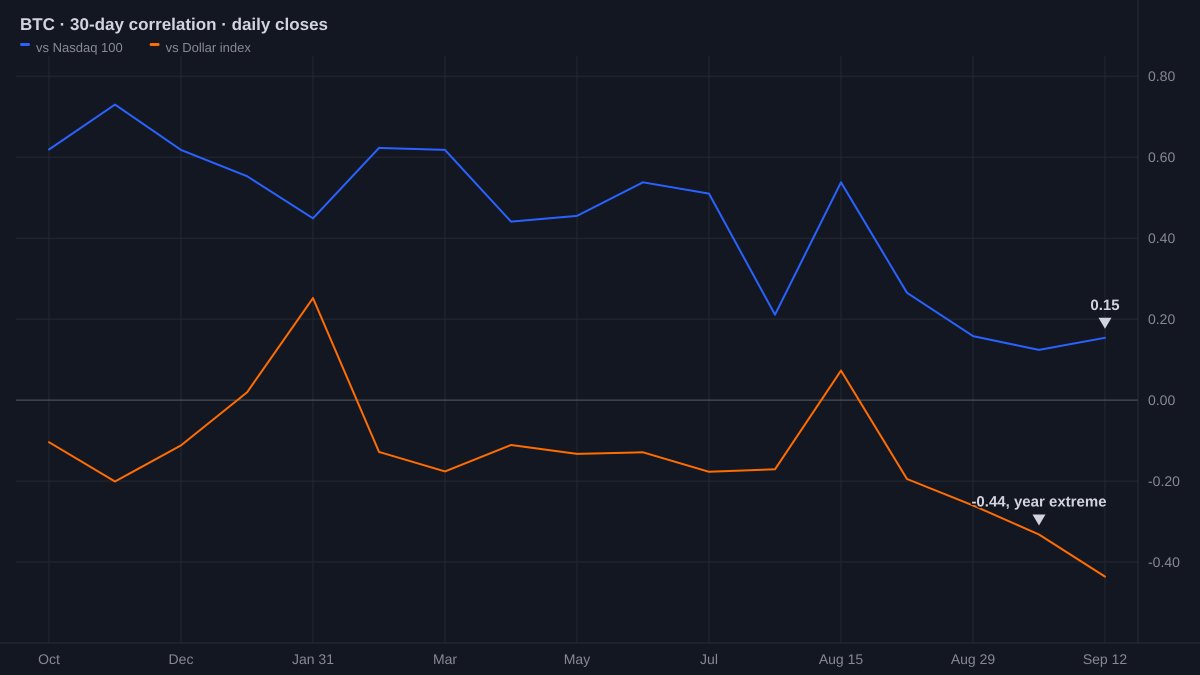
BTC traded like a tech stock all year. Last month it stopped.
Its 30-day Nasdaq correlation is 0.15, weaker than 97% of the past year. Against the dollar index it hit -0.44, the most inverse in a year.
The Fed decides Wednesday.
The dollar runs this tape now.
Daily chart.
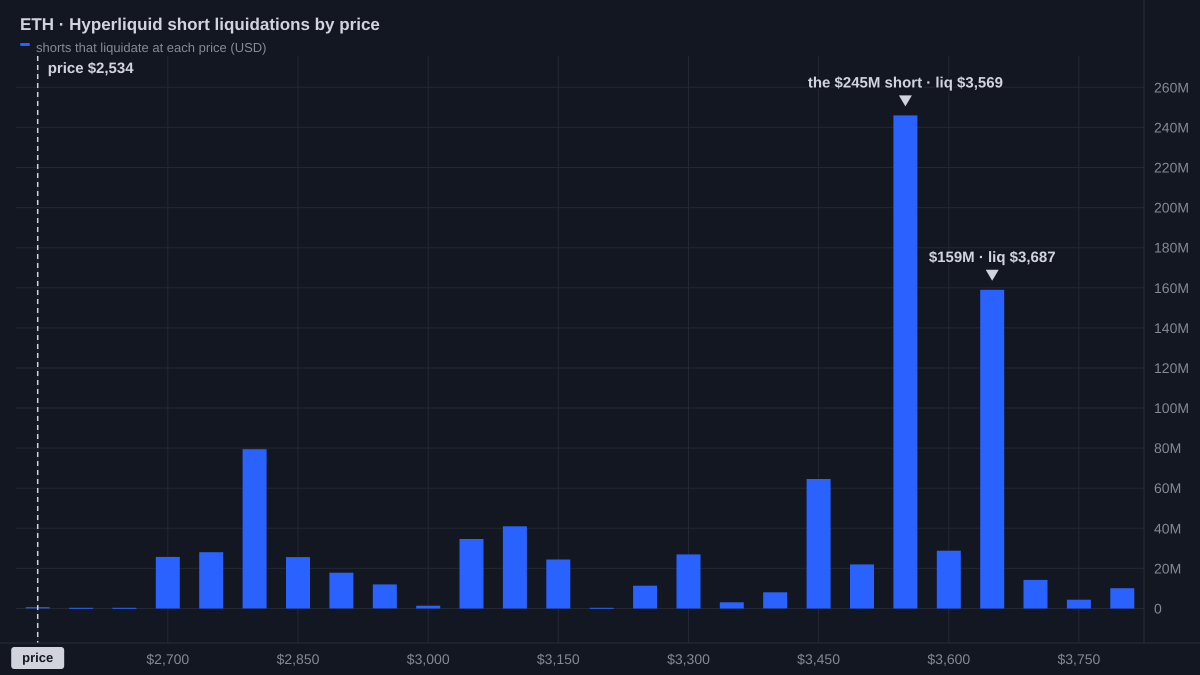
$6.4B of ETH shorts died in 24 hours. The biggest one didn't.
Hyperliquid's largest position is a $245M ETH short. Its owner has made $138M on the venue. He's down $36M this month and still short.
His liquidation: $3,569, 41% above.
Conviction or denial?
Hyperliquid map.
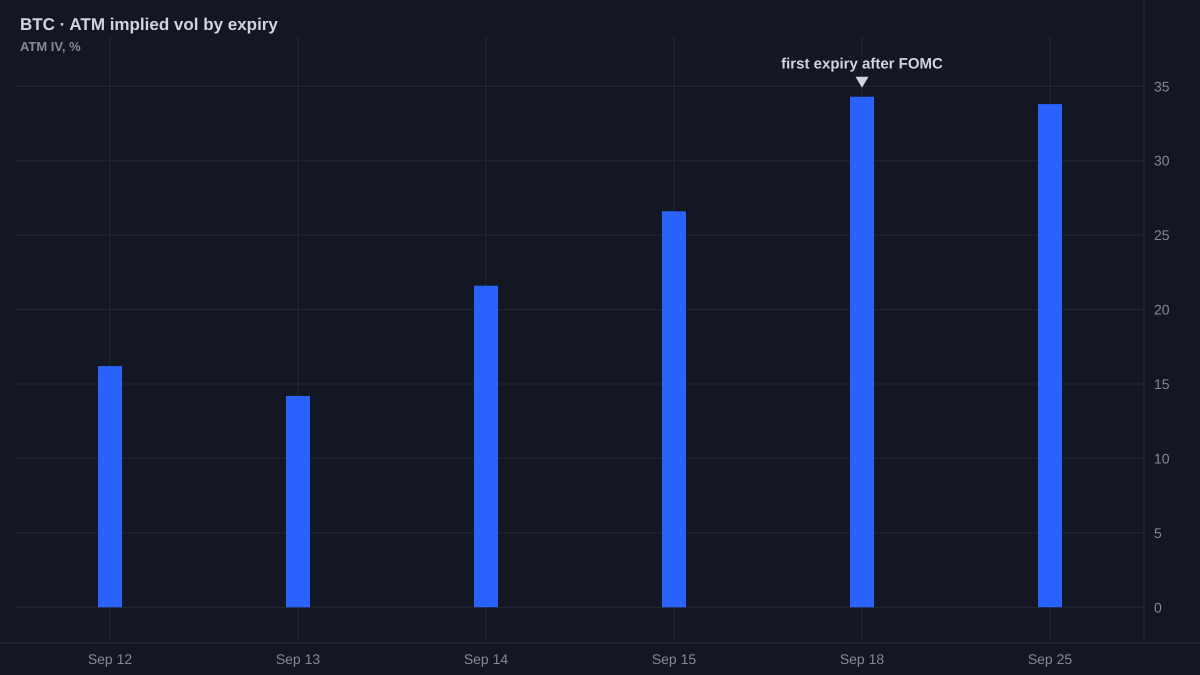
BTC options price Sunday at 14 vol and next Friday at 34.
The gap is one afternoon. FOMC lands Wednesday, with new projections.
The last eight Fed prints moved BTC a median 1.3% in a day. August's ran 6.6%.
The move has a date on it.
Vol by expiry.
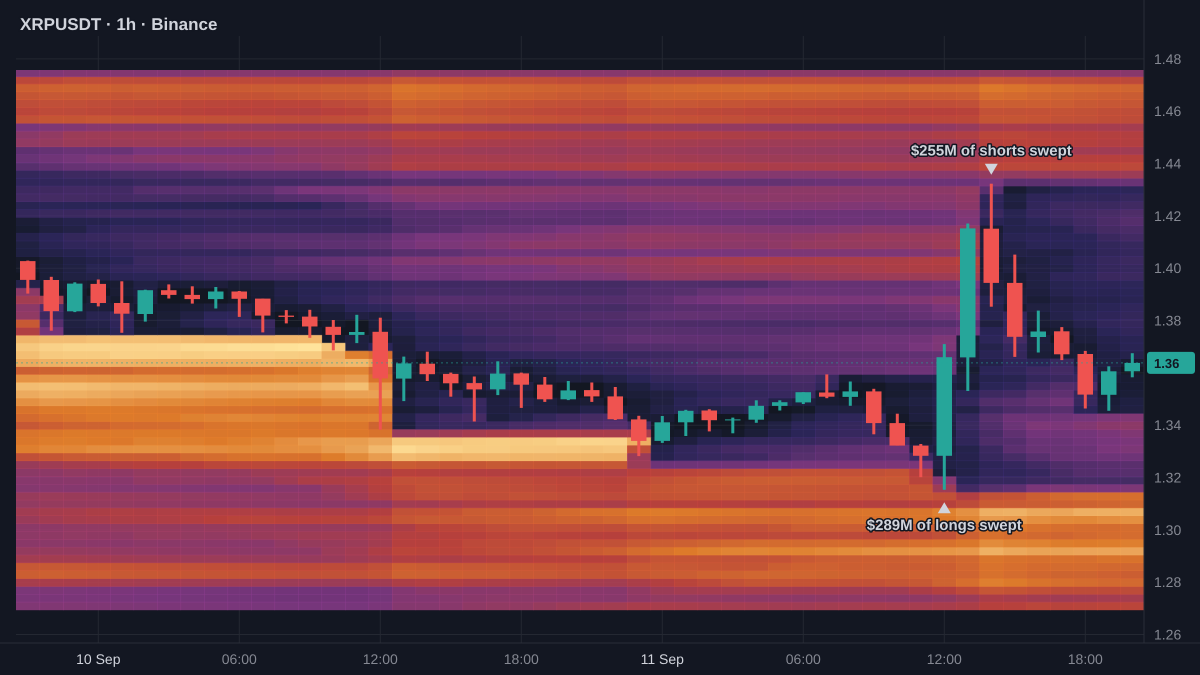
XRP ran 9% in two hours today, then gave most of it back.
The map lost $289M of longs and $255M of shorts in 24 hours. 30% of each side, gone.
Under $6M of leverage is left within 1% of price.
Who reloads first?
1h chart, Binance.
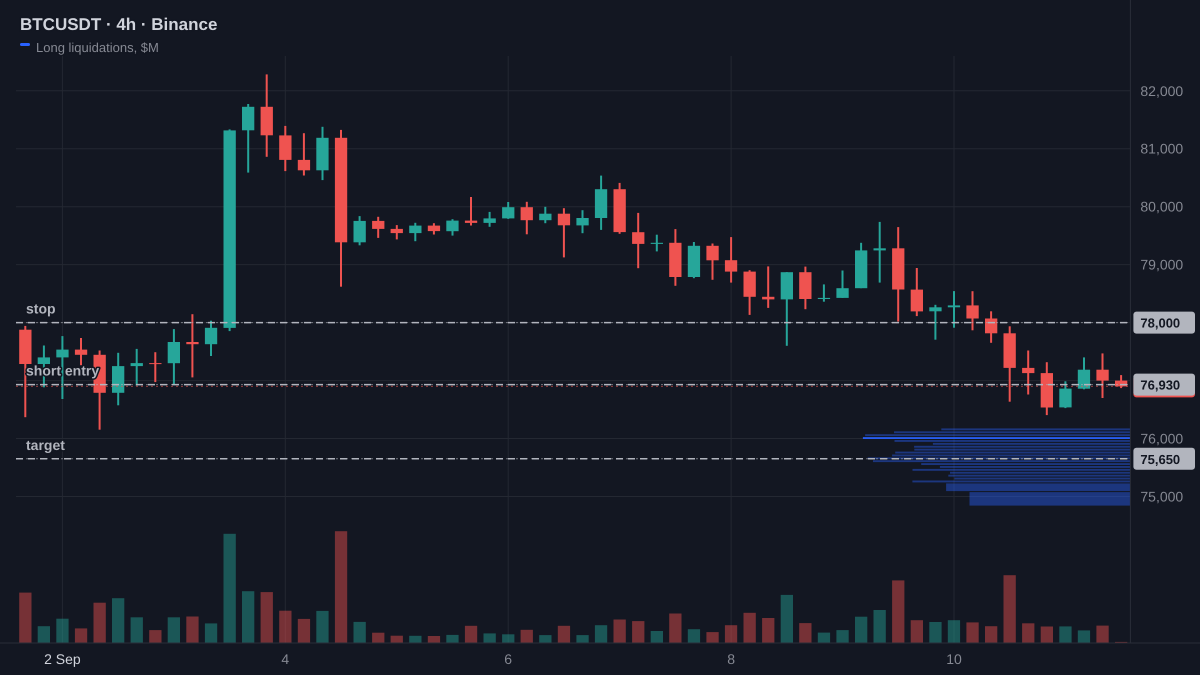
BTC wiped $3.2B of longs off its map in 24 hours. What's left near price is still 85% long.
Short BTC at $76,930. Stop $78,000. Target $75,650.
Funding is still positive. Longs are paying to hold the floor.
The floor is made of the people standing on it.
4h chart, Binance.
ETH moved 0.4% in 24 hours. Its top traders cut their longs to a 30-day low anyway.
From 61% of their book to 56%.
Retail didn't move either: 73% of accounts are long. That gap sits in the top 1% of the past year.
Which side is wrong?
4h chart, Binance.
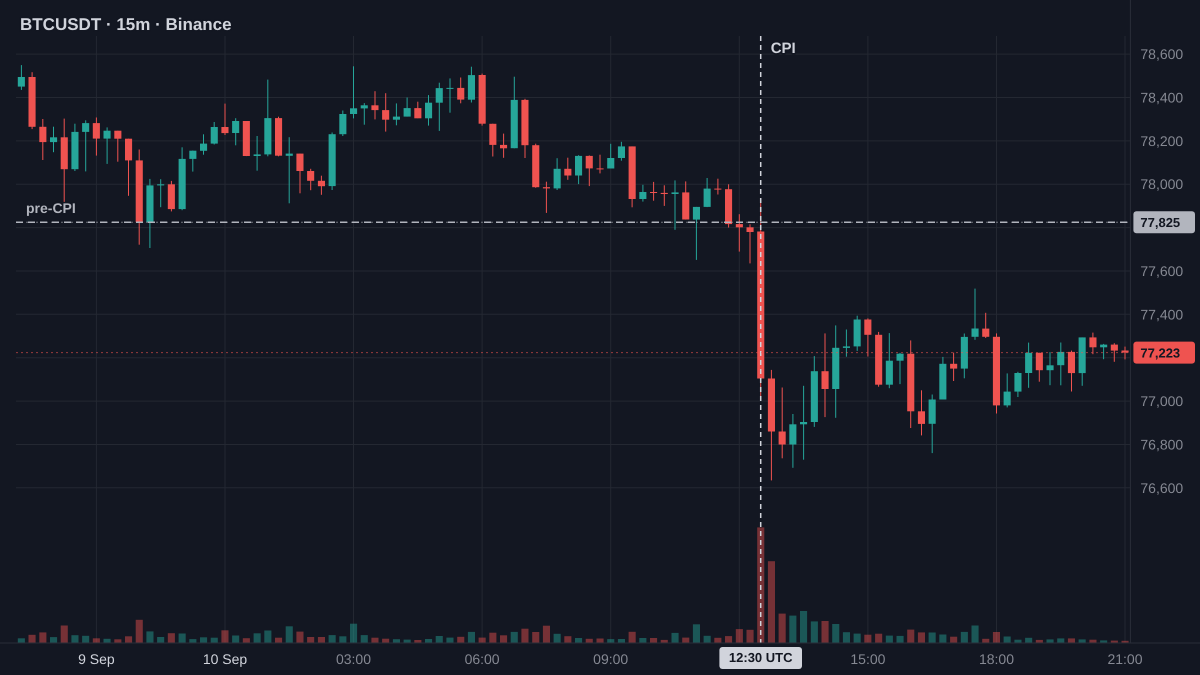
Today's CPI hour cost BTC 1.24%. The other eight prints this year never cost more than 0.2%.
A day later, those eight: up 6, down 2. Worst -1.2%, best +3.8%.
Eight hours in, half the dip is bought.
Same pattern, or the print that breaks it?
15m chart, Binance
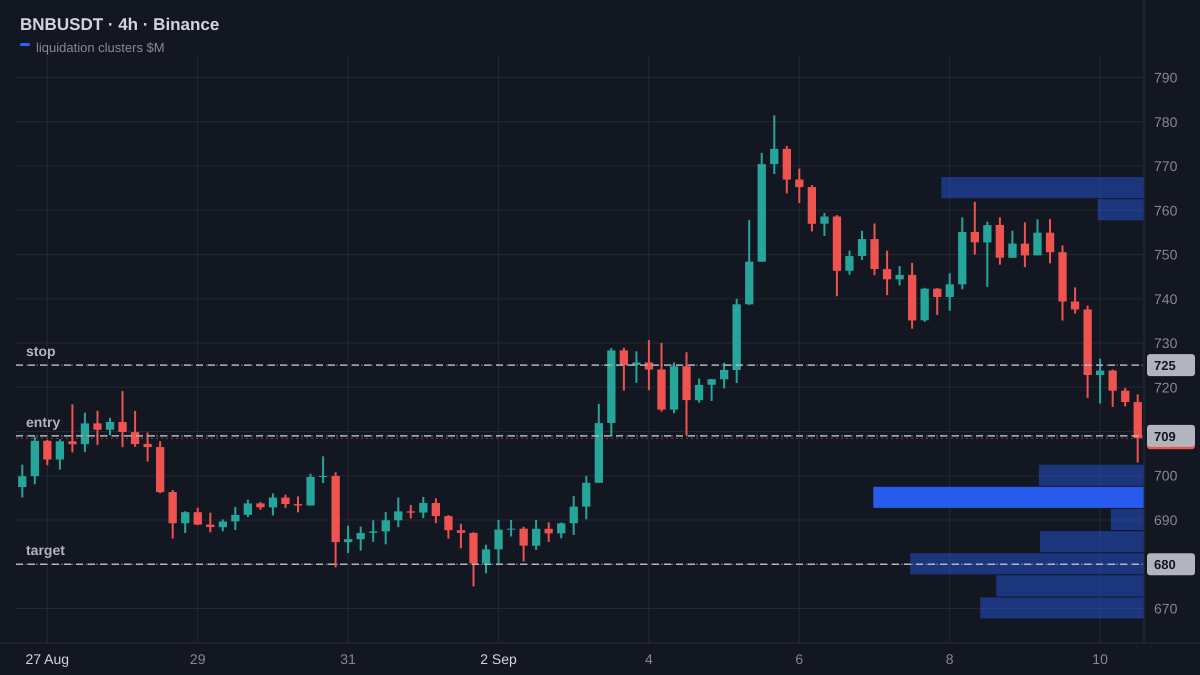
Short BNB at $709. Stop $725. Target $680.
$186M of longs liquidate within 5% below price. The first short cluster waits at $762.
Retail added longs every day of the drop from $781. Top traders cut theirs.
The magnet is below.
4h chart, Binance.
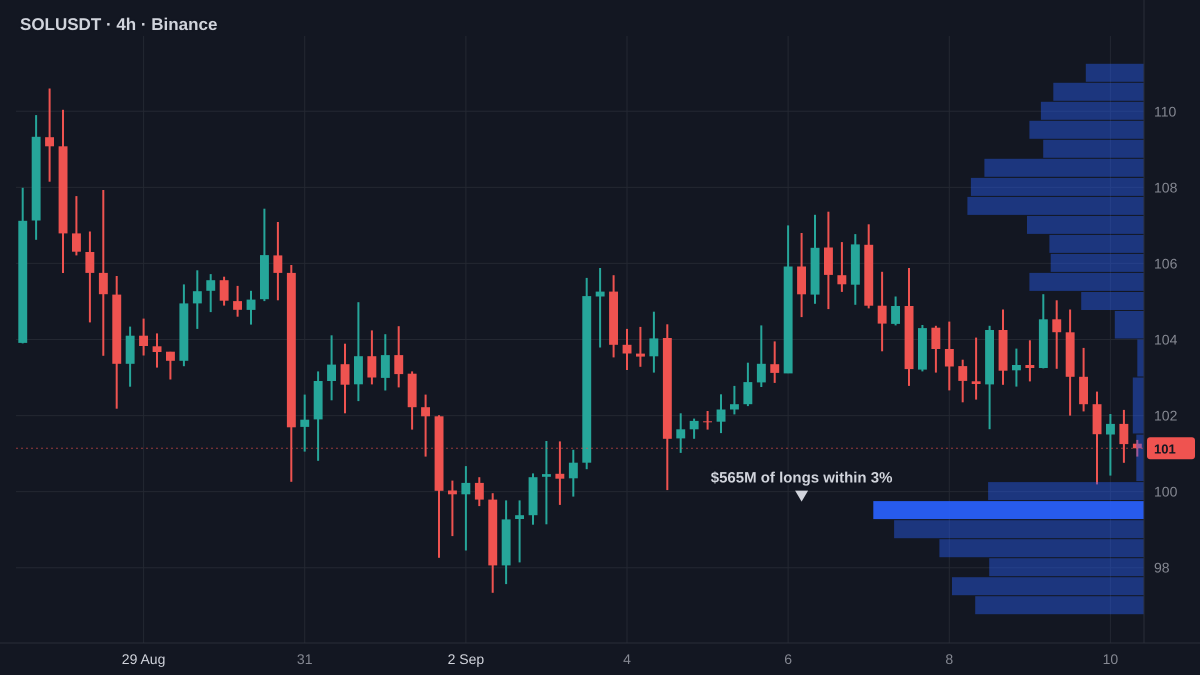
SOL liquidated $565M of longs in 24 hours.
Another $565M sits within 3% of price, stacked between $99 and $100. The same number again.
Shorts within 3% hold $64M.
One flush cleared a quarter of the long side. The next one is already loaded.
4h chart, Binance.
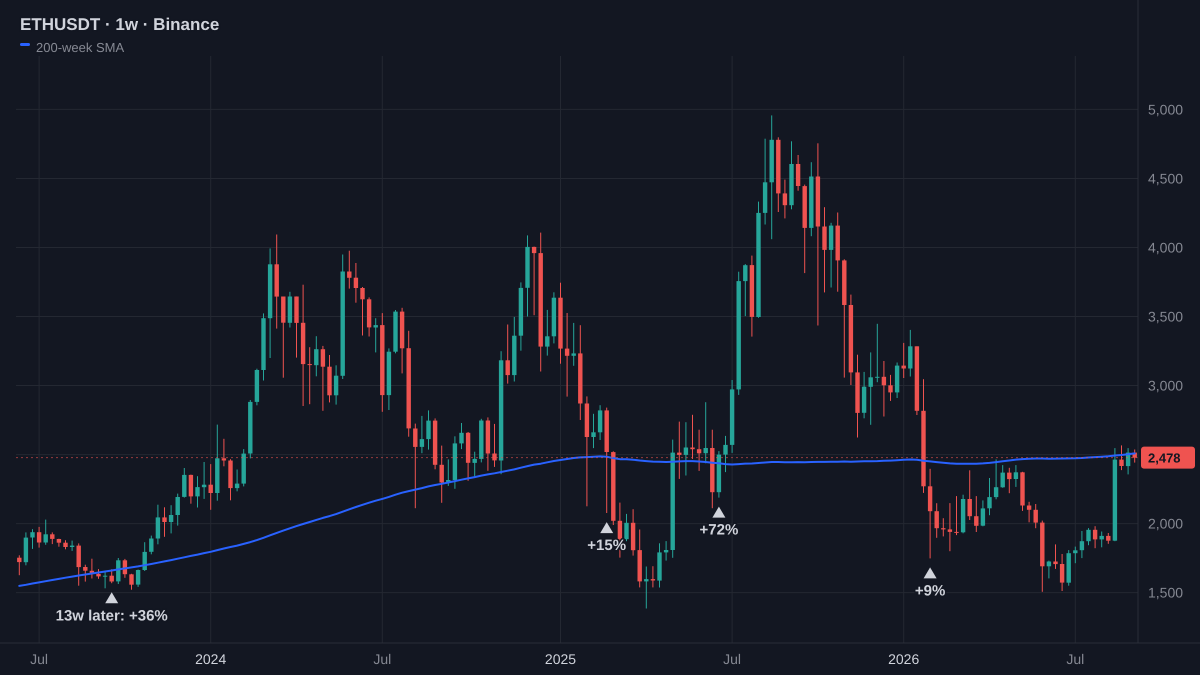
ETH is back under its 200-week average. $2,478 against $2,517.
Fifth slip in three years. All four times before, ETH was higher 13 weeks later. Median +36%. Worst +9%.
But two of the four first fell another 19% or more.
Buy the floor, or the dip below it?
1w chart, Binance.
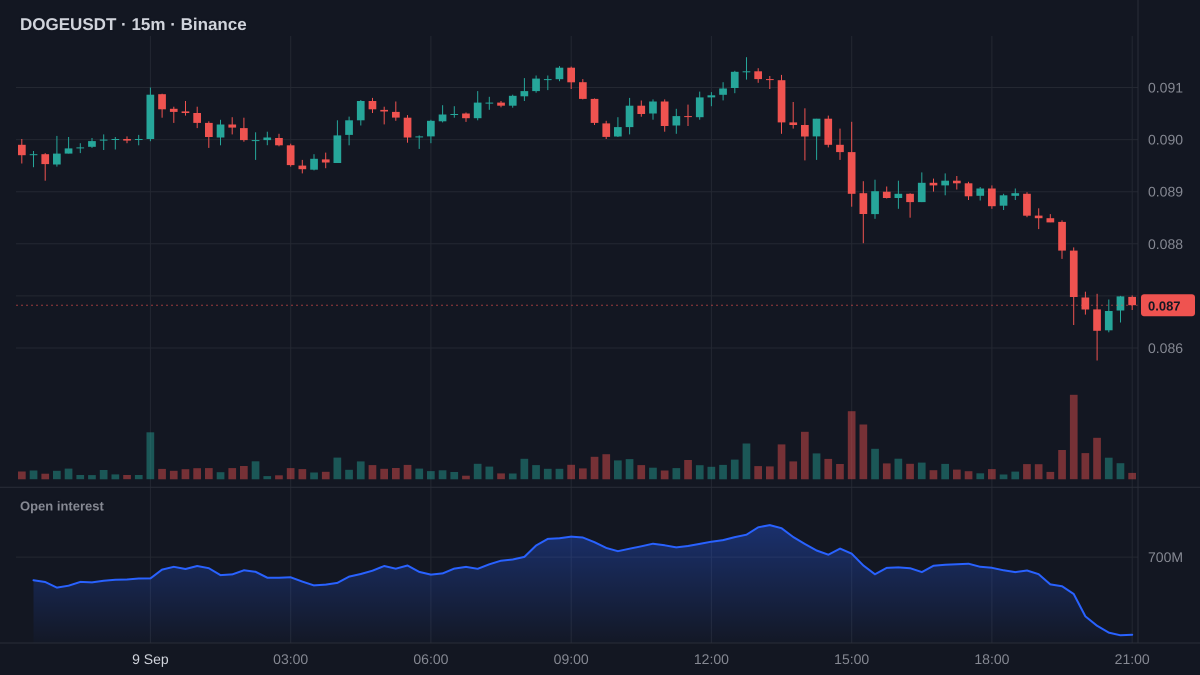
$2.7M. That's every new short opened on DOGE in 24 hours.
Over the same day, $106M of longs got liquidated and traders opened $76M of fresh ones.
Binance top traders sit 78% long. Price fell 3% anyway.
Nobody wants the short side.
15m chart, Binance.