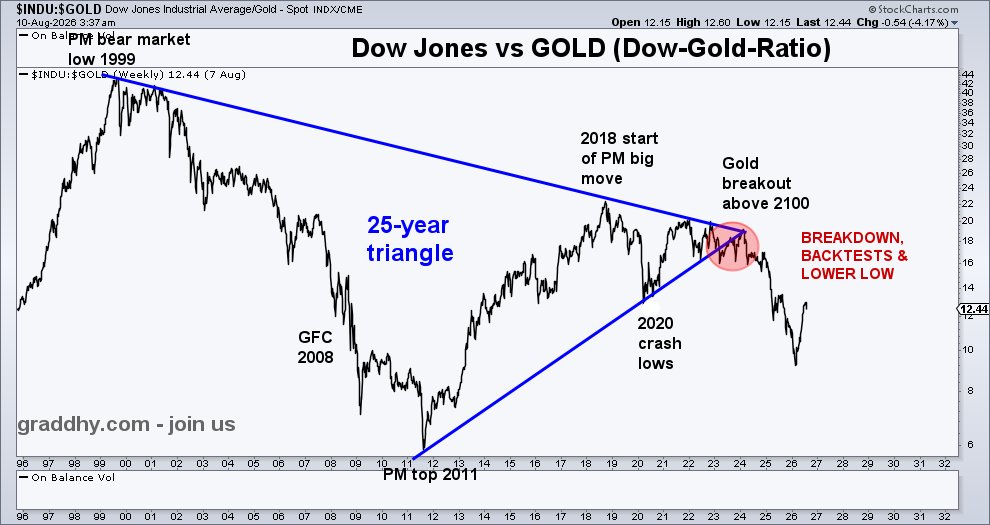
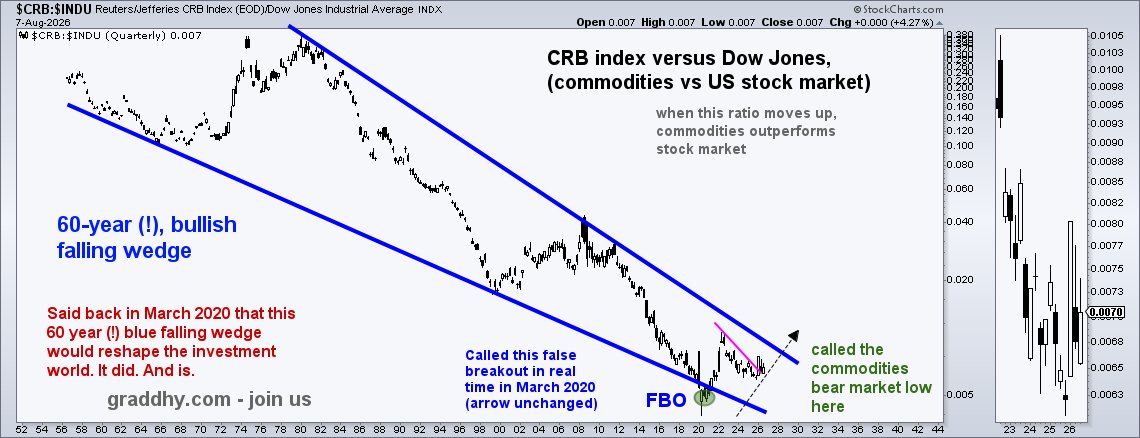
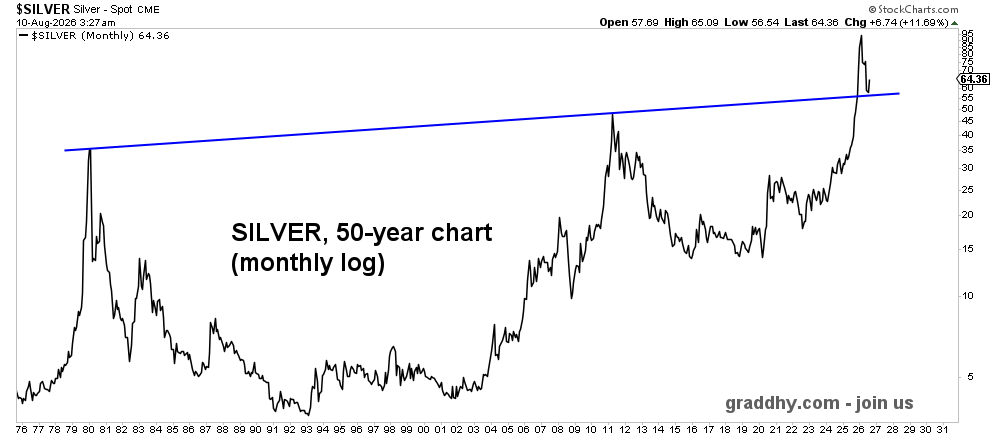
Been saying for many years that capital is now rotating into commodities.
Been posting e.g. these historical big ratio chart turns, plus their breakouts, in real-time.
The commodities bull is end of rainbow stuff.
And, down the road, commodities will be the only game in town.
Oil could reach $140-$150 on the breakout.
If you still doubt that oil will go much, much higher, here is another big picture setup saying it will.
That is an 18-year, very probable, inverse h&s pattern for oil.
The established mass media narrative now is that inflation is coming down, growth will return shortly, unemployment will drop after summer, and that everything will be dandy again in the Fall.
Well, no.
Been saying for years that we will see at least $250-$300 oil during this commodities bull market. Raised that to $369 in the linked post below, in which also nailed the low for the right shoulder for the probable 18-year inverse h&s, at $58.40. Might raise the target even further later on.
Also, posted on oil backtesting the red pattern last month.
Since called the commodities bear market low 6 years ago, in real-time at the lows, I have been saying that this commodities bull market is the best opportunity you will ever have in life to get out of the rat race.
It is extremely important to make the best use of this commodities bull market, for many many reasons.
Which means, following the right people is absolutely vital. #joinus https://t.co/dZoc2yuE1z
Friday ASX chart requests are open.
Drop your tickers below and I’ll pull the charts / technical view.
(Like, share, and jump in Discord if you want all the good stuff.)
Happy weekend everyone 🙏
@ZealandEarly Rode the summit most days on my 12 speed avanti, started from Colombo St, up to sign of kiwi, along the summit, down through summer and finish bottom of Huntsbury Hill.