“I wish it need not have happened in my time," said Frodo. "So do I," said Gandalf, "and so do all who live to see such times. But that is not for them to decide. All we have to decide is what to do with the time that is given us.”
—J.R.R. Tolkien, LOTR
INSTEAD OF WATCHING AN HOUR OF NETFLIX TONIGHT.
This 1-hour Stanford lecture by Joel Peterson will teach you more about negotiation and getting what you want than most people learn in years.
Bookmark it and give it an hour, no matter what.
This doc dropped on a private Telegram for 2 seconds before getting nuked. Someone screenshotted it. Now it's everywhere.
Jim Simons' inner circle called it "the only sheet you need before entering any position." Citadel's risk desk ran these exact numbers before every trade that built their $60B book.
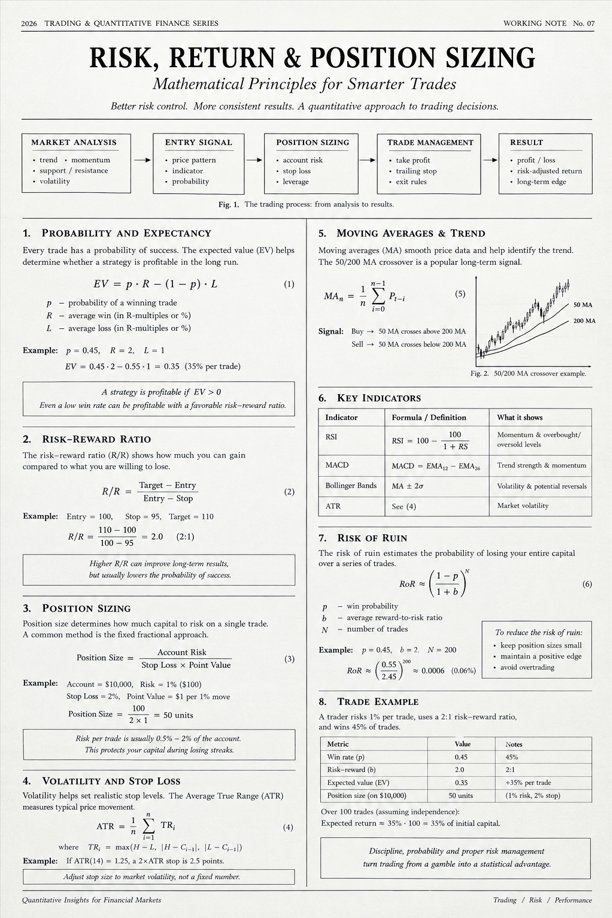
"Risk, Return & Position Sizing." Trading & Quantitative Finance Series. Working Note No. 07. The mathematical cheat sheet that separates traders who print from traders who get rekt - and it fits on one page.
No more gambling. No more guessing entries. Pure math.
Here's the edge most traders never learn.
45% win rate. 2:1 risk-reward. Most retail traders would fade that setup instantly - too many losses. The document runs the expected value: +35% per trade. Over 100 trades that's 35% return on initial capital. The math doesn't care about your emotions. It only cares about edge.
Position sizing. $10,000 account. Risk 1% per trade - $100. Stop loss 2%, point value $1 per move. Position size: 50 units. Fixed. Every time. No FOMO sizing, no revenge trading, no doubling down after a red week. The document calls it the fixed fractional approach. Quants at Two Sigma call it survival.
Risk of Ruin - the calculation nobody talks about. Same 45% win rate, 2:1 reward-to-risk, 200 trades. Probability of blowing the entire account: 0.06%. Not zero. But 0.06%. That's the number that separates professionals from degenerates. Citadel traders know their RoR before they know their entry price.
50/200 MA crossover. RSI. MACD. Bollinger Bands. ATR for stop placement. Every indicator a prop desk runs daily - their formulas, their exact definitions, one table.
Stop guessing. Start calculating.
Watch the moment [Table: Trade Example]
Win rate 45%. EV +35% per trade. Position size 50 units on $10,000.
Over 100 trades: expected return 35% on initial capital.
The only stat sheet you need open before market hours.
2026 Trading & Quantitative Finance Series - Working Note No. 07
Leaked. Deleted. Now back.
bookmark this
So it seems as if this site is full of anonymous people with supernatural trading skills, able to outperform any of us old boring finance guys.
Odd that they all decided not to get a job in the finance industry where they could easily make tens of millions a year.
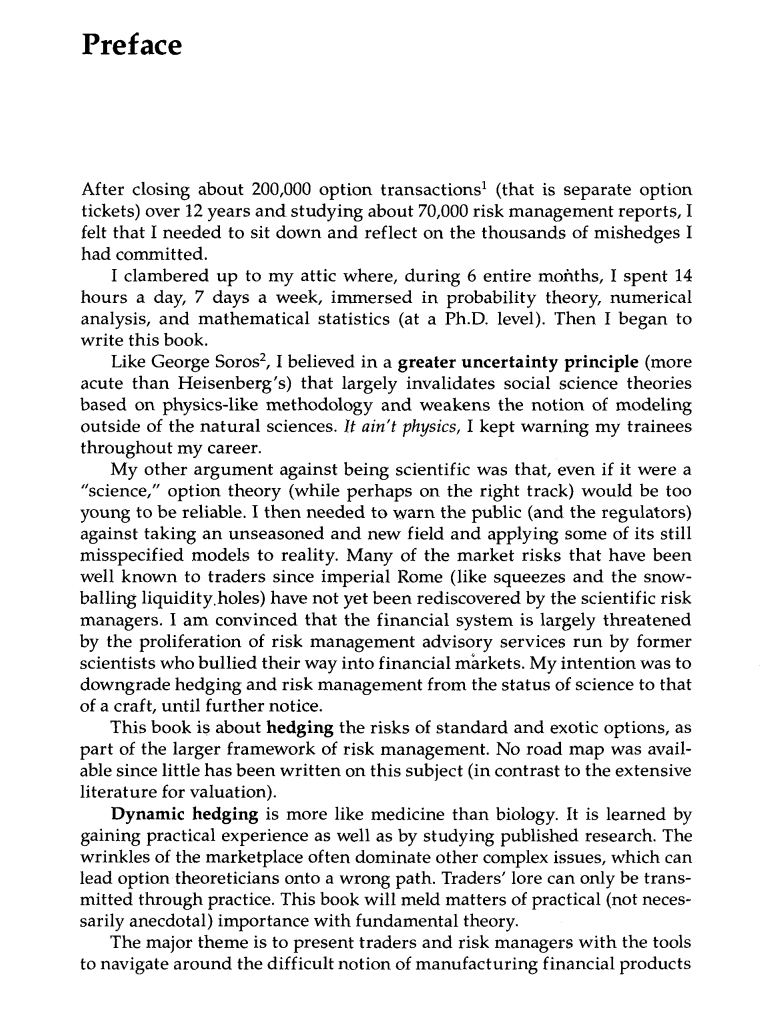
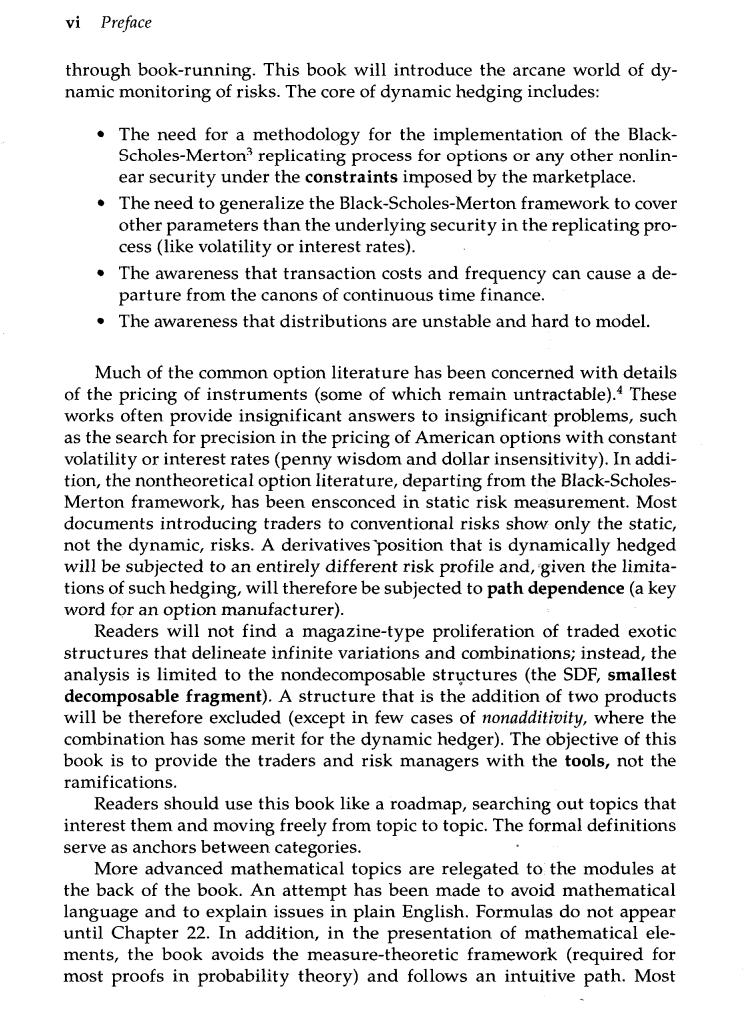
Nassim Taleb closed 200,000 option trades over 12 years.
Then he locked himself in his attic for 6 months, 14 hours a day, 7 days a week, to study probability and reflect on the "thousands of mishedges" he committed.
That's how Dynamic Hedging was written.
The hedge fund manager who taught Michael Burry to pick stocks accidentally destroyed the mutual fund industry in a free Talks at Google lecture on the two-line formula that turned $10,000 into $8.3 million.
His fund charged 2 and 20. He gave the strategy away in a $12 book.
Almost no one paying a financial advisor 1 percent of their retirement has finished the lecture.
His name is Joel Greenblatt. He founded Gotham Capital in 1985 and compounded roughly 40 percent a year for twenty consecutive years. He returned all outside capital in 1994 because his edge was too crowded to scale.
He has been teaching value investing at Columbia Business School every year since 1996. Michael Burry - the doctor who shorted the housing bubble in "The Big Short" - learned to pick stocks from Greenblatt's 1997 book.
The 55-minute clip in this video is Greenblatt at Google in 2017 walking a room of engineers through his Magic Formula.
The whole framework fits on one napkin. Rank every stock in the S&P 500 by return on invested capital, highest first. Then rank every stock by earnings yield, highest first. Sum the two rankings. Buy the top twenty. Hold for one year. Sell. Repeat.
That single formula would have beaten the S&P 500 by roughly 14 percent a year over the last three decades if any retail investor had actually followed it.
"Cheap and good beats expensive and average. Every time."
That is Joel Greenblatt at Google in 2017. He has repeated the sentence in every public talk since. Almost no retail investor buying Nvidia at $140 has heard it.
Every hedge fund on Wall Street pays $500,000-a-year analysts to backtest more sophisticated versions of the same equation. Every financial advisor in America charges you 1 percent of your account per year to underperform it.
The Talks at Google video is free on YouTube. "The Little Book That Beats the Market" is twelve dollars on Amazon.
Almost none of the millions who watched have ever run the two-line formula on their own portfolio.
The framework is free. The willingness to actually run it before your next stock pick, retirement rebalance, or brokerage transfer is the entire edge.
ANNOUNCEMENT:
We are excited to present The Kobeissi Letter’s 2025 performance report.
Our analysis provided a net return of +30.7% in 2025, outperforming the S&P 500's 2025 return of +16.4%.
Since 2020, our investment strategy has now returned +516.3%, significantly outperforming the S&P 500’s +111.9% return over the same period.
Our 2025 return builds on +8.1% in 2024, +15.5% in 2023, +92.8% in 2022, +35.3% in 2021, and +44.8% in 2020.
Since 2020, our analysis has delivered a Compound Annual Growth Rate (CAGR) of +35.4%, outperforming the S&P 500’s +13.3% CAGR.
Read the full annual report here:
https://t.co/p5CVL5ZckU
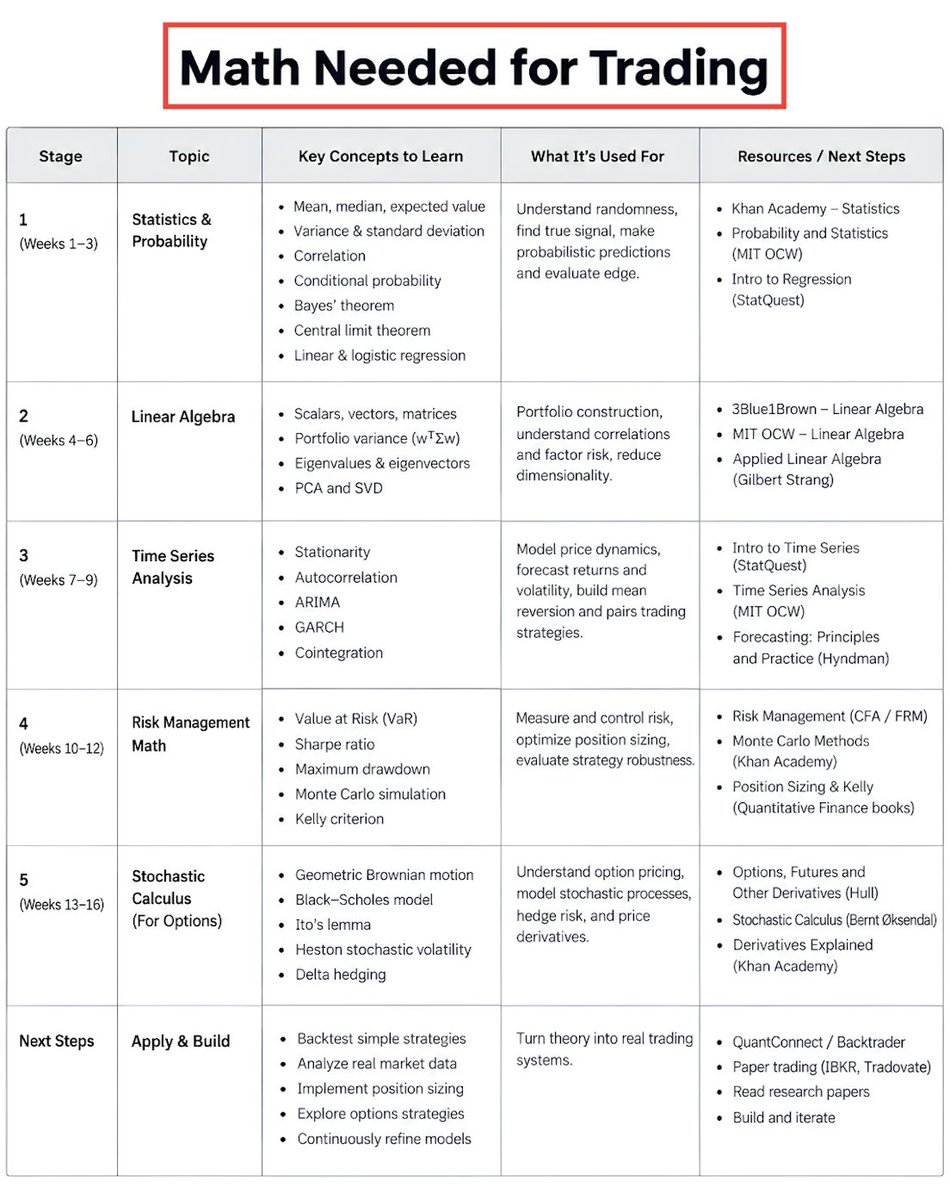
THE MATH NEEDED FOR TRADING (COMPLETE ROADMAP):
today I'll will break down the essential math you need for trading & this is the exact roadmap that helped me personally
when i started, i thought math was for interviews, two months into live trading i realized every position i took was pure math running in production
here's the complete map of what math actually fires on real trades:
---------------
1. statistics and probability
every price move is signal plus randomness. statistics separates the two
what you need:
> mean, median, expected value = EV formula (win% × avg win) - (loss% × avg loss) is what you're actually maximizing
> variance and standard deviation = foundation of every position sizing formula, becomes volatility when applied to returns
> correlation from -1 to +1 = tells you if strategies are actually independent
> correlation 0.9 across 3 strategies = you have one strategy dressed as three
> conditional probability = the biggest edge upgrade retail misses. P(win) = 55% unconditionally, but 70% when VIX < 15
> Bayes' theorem = how you update beliefs when new information arrives. never work with static beliefs
> central limit theorem = why portfolio-level statistics behave cleaner than individual trades
> linear and logistic regression = building blocks for mean reversion and binary prediction
---------------
2. linear algebra
the moment you hold multiple positions, you're doing linear algebra whether you know it or not
what you need:
> scalars, vectors, matrices = your portfolio is a weighted sum of vectors
> portfolio variance = w^T Σ w. not the sum of individual variances. one matrix operation
> eigenvalues and eigenvectors = reveal where risk actually lives. in a 500-stock universe, top 5 eigenvectors explain 70% of variance. the other 495 are noise
> PCA and SVD = reduce 50 correlated indicators into 5 independent factors explaining 90% of variation
---------------
3. time series analysis
markets have memory. today's price depends on yesterday's. volatility clusters. trends persist
what you need:
> stationarity = assumption most statistical tests make, but markets aren't stationary, this is why strategies decay when regime shifts
> autocorrelation = positive means momentum, negative means mean reversion, zero means random walk
> ARIMA = framework for forecasting returns and volatility
> GARCH = formalizes what every trader knows, volatility clusters. after a big move expect more volatility
> cointegration = the foundation of pairs trading. two assets can both trend but their spread stays stationary
---------------
4. risk management math
edge doesn't matter if you size wrong
what you need:
> Value at Risk = 95% VaR of $5,000 means 95% of the time you won't lose more, but 5% of the time you might lose much more
> Sharpe ratio = (return - risk-free rate) / volatility. institutional threshold is Sharpe > 1.5 before deployment
> maximum drawdown = biggest peak-to-trough loss. more intuitive than volatility for most traders
> Monte Carlo simulation = randomizes trade sequencing to show the range of possible outcomes
> Kelly criterion = f* = (bp - q) / b. professionals use 0.25x to 0.5x fractional Kelly because your true edge is never certain
---------------
5. stochastic calculus (for options)
if you trade options, every price on your screen came from a stochastic differential equation
what you need:
> Black-Scholes = dS = μS dt + σS dW. the underlying follows geometric Brownian motion
> Ito's Lemma = why the σ² term exists. this is why gamma exists
> Heston stochastic volatility = dv = κ(θ - v)dt + ξ√v dW. captures the volatility smile that Black-Scholes misses
> delta hedging = stochastic calculus running in production. every rehedge is dictated by the SDE governing the underlying
---------------
MINIMUM TO START
you don't need everything above to start
for your first backtest:
> mean, median, standard deviation
> correlation
> basic probability
> Sharpe ratio and max drawdown
start with statistics, that alone separates you from 95% of retail traders
---------------
every real trade is math executing in production:
> entry = conditional probability
> validation = statistics
> portfolio = linear algebra
> sizing = Kelly optimization
> risk = VaR, Sharpe, max drawdown
> options = stochastic calculus
the traders who make consistent money see markets as continuous equations, everyone else guesses
if you're a complete beginner shoot me a DM and I'll share the resources with you
MATH IS EVERYTHING <3
A dead MIT professor accidentally destroyed the $20 billion executive coaching industry with one hour of lecture, and ten million people have already watched him do it.
He filmed it once in January 2018 and died eighteen months later.
Executive coaches charge fifteen thousand dollars a session to teach a third of what he covered in that one hour for free.
His name was Patrick Winston. He ran the MIT Artificial Intelligence Laboratory from 1972 to 1997 and wrote the AI textbook every computer science major in the world read for thirty years.
Every January for four decades, he gave a lecture called "How to Speak."
His entire framework fits on a napkin.
Do not read. Be in the image. Keep images simple. Eliminate clutter. Start with an empathetic connection. End with a punch line the audience can repeat over dinner. Never open with a joke. Never end with "thank you."
That last rule alone has probably cost the executive coaching industry a hundred million dollars.
"Your success in life will be determined largely by your ability to speak, your ability to write, and the quality of your ideas. In that order."
That is the actual opening line of the lecture. Winston believed it strongly enough to spend fifty years teaching computer scientists how to talk.
Founders spend $80,000 on an MBA and then hire a communications coach to teach them the same material Winston filmed once for free. Engineers write brilliant code and lose promotions to teammates who watched this lecture on the train.
The lecture is free on MIT OpenCourseWare. The textbook is free on his page.
Winston died in 2019. Almost none of the ten million viewers have actually implemented the four rules on the napkin.
The napkin is free. The willingness to actually use it in your next meeting is the entire edge.
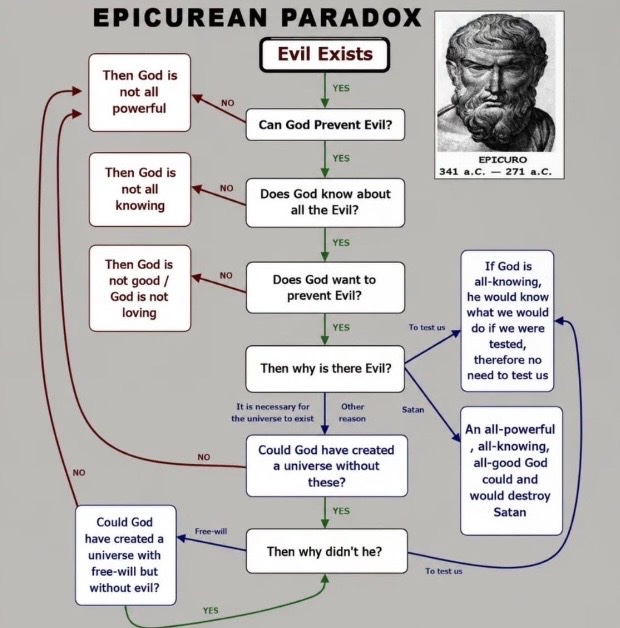
The Epicurean Paradox is a philosophical dilemma that asks how an all-powerful, all-knowing, and all-loving God can exist alongside the presence of evil and suffering.
The Epicurean Paradox is a version of the ancient “problem of evil”: if God is all-powerful, all-knowing, and perfectly good, why do evil and suffering exist? If God wants to stop evil but cannot, then he is not all-powerful. If he can stop it but chooses not to, his perfect goodness comes into question.
Despite its name, the famous formulation is probably not a surviving quotation from Epicurus (341–270 BC). It is known primarily through the Christian writer Lactantius, who lived roughly 500–600 years later and attributed a similar argument to Epicurus. Centuries later, philosophers such as David Hume helped popularize versions of the dilemma.
The problem of evil became one of the most enduring debates in the philosophy of religion. Proposed responses include the free-will defense, the idea that suffering may contribute to moral or spiritual growth, and the possibility that humans simply cannot understand all of the reasons behind God’s actions.
This man teaches at a community college in California.
His salary: around $800,000 a year.
The engineers who passed calculus because of him: $1,800,000 to start.
He has more calculus students than Harvard, MIT, and Stanford combined.
This is Professor Leonard's Calculus 2, Lecture 6.2. Free on YouTube.
Professor Leonard has taught calculus on YouTube for over a decade. His channel has millions of subscribers across 150 countries. Every major university has students who watch him the night before their exam.
Then the concept.
An inverse function is a machine that undoes another machine. If a function takes 2 and gives you 8, the inverse takes 8 and gives you back 2. Finding an inverse means switching every x and y in the equation and solving for y again. The graph flips across the line y = x like a mirror.
Then the problem.
Sometimes it is easy to find the inverse. Sometimes it is impossible to write it explicitly. A function like 3π sin x + sin x cannot be solved for x with algebra. You have to think. What angle makes the whole thing equal to 1? You work backwards through the unit circle until the answer appears.
Then the shortcut.
If you want the derivative of an inverse at a point, you do not need the inverse itself. You only need the derivative of the original function. The formula: the derivative of the inverse at a point equals 1 divided by the derivative of the original function evaluated at the switched point. The inverse flips the coordinates, so you flip where you plug in.
Watch the moment he shows why G prime of 8 equals 1/12 without ever writing the inverse function.
Every engineering student memorizes the derivative rules. Professor Leonard's lecture is the one that shows why the inverse derivative formula is just those same rules run backwards.
A software engineer at a semiconductor company in Austin said Professor Leonard's channel is the reason she passed Calculus 2 on her second attempt. She graduated, joined the company, and now makes $165,000 a year.
Bookmark this and watch later - after this lecture every inverse problem on your exam will feel like a question you already answered.
An MIT professor spent 50 minutes proving that the hardest part of calculus isn't calculus.
The surprising part is that the actual calculus is often the easy step.
In his first MIT 18.01 lecture, the professor breaks down derivatives from scratch: start with a curve, take a secant line, move the second point toward the first, and watch the slope converge to the tangent.
That process produces one of the most important formulas in mathematics:
f′(x) = lim Δx→0 [f(x+Δx) − f(x)] / Δx
Then comes the part most students hate.
Not the calculus.
Everything around it.
He argues that calculus gets its reputation for being difficult because problems are buried inside algebra, geometry, notation and everything else learned before calculus.
And once you understand the core idea, an entire family of derivatives falls out:
d/dx(xⁿ) = nxⁿ⁻¹
One calculation gives you the rule behind polynomial differentiation.
The lesson isn't really about derivatives.
It's about isolating the one hard idea inside a complicated problem.
Most people try to solve everything at once.
Experts find the one thing that actually matters.
A broke Italian gambler in 1560 wrote a short manual on how to win at dice. Nobody in finance read it for four hundred years.
The nine-trillion-dollar insurance industry runs on his equation.
His name was Girolamo Cardano. The book was called Liber de Ludo Aleae. He scribbled it in Milan to settle a card debt. Every dollar of premium ever collected on Earth is a footnote to that scribble.
Nobody connected the dots until 1996. A ninety-year-old man in New York wrote a book called Against the Gods and traced every modern risk model back to Cardano's manual. Wall Street called him the historian of risk.
His name was Peter Bernstein. In 2008 a small production company filmed him for thirteen minutes. He walked through the entire five-hundred-year arc. Cardano to Pascal to Fermat to Black-Scholes.
Then he stopped and said the industry had built glass towers on the back of an idea a broke gambler scribbled to shave the house edge.
He died the following summer. Age ninety.
There are only four ways to make money. Labor. Capital. Arbitrage. Insurance. Insurance is the oldest and the least visible. Every actuary on Earth still prices catastrophe risk with Cardano's framework.
The video is thirteen minutes long. Free on YouTube. Twenty-nine thousand people have watched it.
10 books recommended by Nassim Taleb:
1) Scale by Geoffrey West
“Scaling is the most important yet most hidden and rarely discussed attribute—without understanding it one cannot possibly understand the world.”
robert engle won the nobel prize in economics for proving something hedge funds already knew
they never bothered to mention it to retail
price direction is mostly noise. but volatility? predictable. mathematically, provably, across every liquid market ever studied
it clusters - that's not a pattern someone found, it's a structural law. high vol today predicts high vol tomorrow with 70%+ historical accuracy
the model is called GARCH. published in every econometrics textbook on earth, chapter 4, about 60 lines of python to run
quant desks at citadel and D.E. Shaw don't ask "will it go up?" - they ask "will the next move be large or small?"
because sizing correctly inside a vol regime is worth more than being right on direction
a trader right 48% of the time who sizes with vol awareness beats someone right 62% of the time sizing blindly - every time, over any long enough sample
run it on 10 years of SPY data:
> low vol state -> 74% chance next session stays low vol
> vol spike -> 81% chance next session is also elevated
now you're not predicting markets. you're reading a state machine the market keeps filling in for you every single session with real data
the predictable part of markets was never price direction
it was the distribution of price. the size of the moves. which regime you're currently inside
math is free, data is free, implementation is free
you were just told to stare at candlesticks instead
Bookmark this before the feed buries it
A hedge fund manager put a jar of 1,776 jelly beans in front of a room at Google and proved in two rounds why most investors will always lose money. for free.
His name is Joel Greenblatt. Gotham Capital. 50% a year for a decade. he asked the room to guess how many jelly beans were in the jar.
First round: everyone wrote their guess silently. no talking. no looking around. the average was 1,771. five off. almost perfect.
Second round: people said their guesses out loud. heard each other. adjusted. the average collapsed to 850. same room. same jar. the only thing that changed was influence.
He told the room: the second guess is the stock market. everyone knows what they just read in the paper. what the guy next to them said. what they saw in the news. the cold independent guess was better. that is not how the market works. but that is where the opportunity is.
Then he showed 20 years of data. the cheapest 20% of stocks averaged 38% a year. the most expensive averaged the least. the strategy is simple. the reason it still works is that people are still crazy. and they always will be.
55 minutes. one jar. still free.
Insurance is the oldest of the four ways. It is a nine-trillion-dollar global industry. The equation underneath it was invented in 1560 by a broke Italian gambler.
His name was Girolamo Cardano. He wrote a book called Liber de Ludo Aleae. A short manual on how to win at dice. Nobody in finance read it for four hundred years.
Then in 1996 a ninety-year-old man in New York wrote a book that traced every modern risk model back to that manual. He called it Against the Gods. One thesis. Every dollar of premium ever collected on Earth is a footnote to a gambler scribbling in Milan.
His name was Peter Bernstein. He founded the Journal of Portfolio Management in 1974 and ran money at Bernstein-Macaulay before that. Wall Street called him the historian of risk.
In 2008 a small production company filmed him for thirteen minutes. He walked through the entire five-hundred-year arc. Cardano to Pascal to Fermat to Black-Scholes. Then he stopped and said the industry had built glass towers on the back of an idea a broke Italian scribbled to settle a card debt.
He died the following summer. Age ninety.
Reinsurance premiums crossed six hundred billion dollars last year. Every actuary on Earth prices catastrophe risk with the same expected-value framework Cardano invented to shave the house edge in Milan.
The video is thirteen minutes and twenty-two seconds long. Free. Eleven years on YouTube. Twenty-nine thousand people have watched it.
Almost none of them work in insurance.