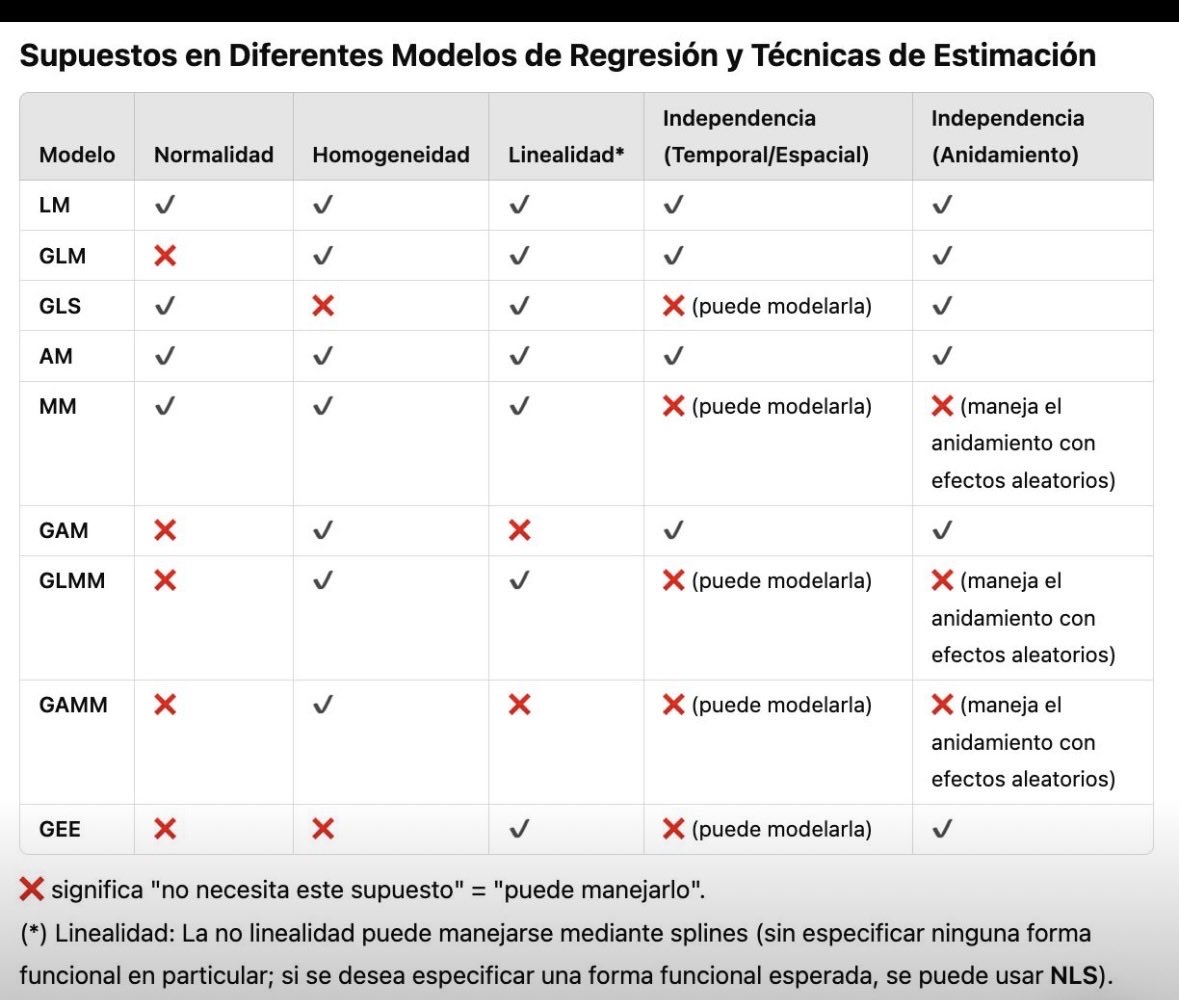
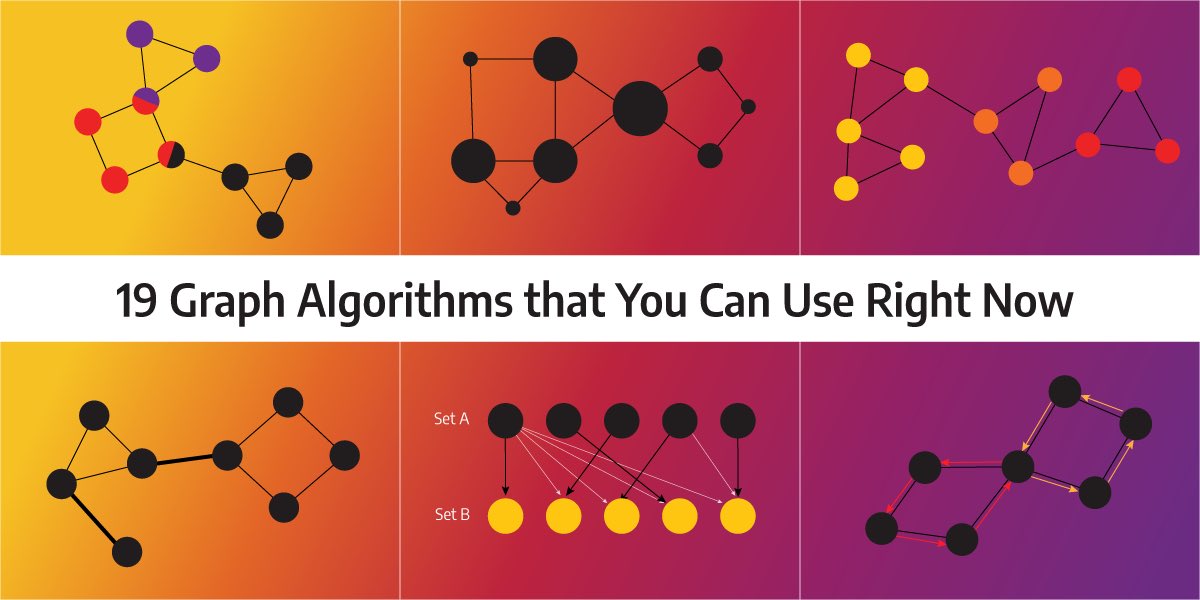
🔥 ¿𝐐𝐔É 𝐌𝐎𝐃𝐄𝐋𝐎 𝐃𝐄 𝐑𝐄𝐆𝐑𝐄𝐒𝐈Ó𝐍 𝐄𝐋𝐄𝐆𝐈𝐑? 🔥
Las siglas como 𝗟𝗠, 𝗚𝗟𝗠, 𝗚𝗔𝗠 o 𝗚𝗟𝗠𝗠 pueden sonar a chino, pero intentaré ponerlo simple con esta guía para elegir tu próximo modelo.
https://t.co/evTxTIIPPK
#stats#DataScience#cienciadedatos#rstats
🚀 Aprende R y Tidyverse con los tutoriales (ex Primers) de Posit 🚀
💡 Estos tutoriales fueron creados por el equipo de RStudio/Posit Education y están disponibles de manera abierta (gratuita) en GitHub.🎉
#DataScience#RStats#Tidyverse#RForDataScience#LearnR#stats#dataviz
@NVIDIAGeForceES#GeForceSeason ❄️
Una GeForce RTX 5090 sería el impulso perfecto para continuar mis proyectos, disfrutar mis juegos favoritos y vivir experiencias que hoy mi equipo ya no puede soportar. Sería un regalo que no solo transforma mi PC, sino mis metas para el próximo año. 🎄💚
If you're still using raw R outputs for presentations, it's time for an upgrade! Tools like gtsummary bring your statistical results to life, making them much more digestible for non-technical audiences.
While base R functions like summary(fit) work well for statisticians, they can be too complex for stakeholders who aren’t familiar with the detailed output. The tbl_regression() function from gtsummary makes it easy to present regression results clearly.
In addition, gtsummary is highly versatile - it’s not just limited to linear regression. You can apply it to generalized linear models, survival analyses, and more. The package even allows you to include p-values, confidence intervals, and other important statistics directly within the tables, helping you to better communicate statistical results.
Here are a few standout benefits:
✅ Simplified output that’s easier for stakeholders to understand
✅ Works seamlessly with a variety of models
✅ Customizable tables with key statistics like p-values, confidence intervals, and more
The visualization included here was originally shared in a post by Dr. Alexander Krannich. Thanks to Alexander for inspiring me to create this post.
Interested in more tips on data science, statistics, Python, and R? Be sure to sign up for my free email newsletter! Check out this link for more details: https://t.co/X93SeCe0rb
#Rpackage #DataScientist #datastructure #RStats #Statistical #Python #database
📚¿𝗤𝘂𝗶𝗲𝗿𝗲s 𝗮𝗽𝗿𝗲𝗻𝗱𝗲𝗿 𝗲𝘀𝘁𝗮𝗱𝗶́𝘀𝘁𝗶𝗰𝗮 𝗰𝗼𝗻 R y no sabes por dónde empezar (o continuar)?
Mi biblioteca esencial de recursos organizada por nivel de dificultad.🧵👇
🔗Lista completa de libros recomendados: https://t.co/11GsBRM2Zj
#Rstats#stats#datascience
🚨 ¿𝗦𝗮𝗯𝗶́𝗮𝘀 𝗾𝘂𝗲 𝗽𝘂𝗲𝗱𝗲𝘀 𝘂𝘁𝗶𝗹𝗶𝘇𝗮𝗿 𝗥 𝗱𝗲 𝗳𝗼𝗿𝗺𝗮 𝗶𝗻𝘁𝗲𝗿𝗮𝗰𝘁𝗶𝘃𝗮 𝗽𝗮𝗿𝗮 𝗮𝗰𝗲𝗹𝗲𝗿𝗮𝗿 𝘁𝘂 𝗳𝗹𝘂𝗷𝗼 𝗱𝗲 𝘁𝗿𝗮𝗯𝗮𝗷𝗼? 🚨
Los Addins de RStudio no reemplazan tu código, lo potencian ⚡
Ejecuta tareas repetitivas o complejas en un clic.🧵👇
El primer metapaquete regional enfocado en Latinoamérica
🔗 https://t.co/Hy5D20yadE
Latamverse es un metapaquete que reúne una colección completa de paquetes R que brindan acceso a funciones de API y conjuntos de datos seleccionados de Argentina, Brasil, Chile, Colombia y Perú.
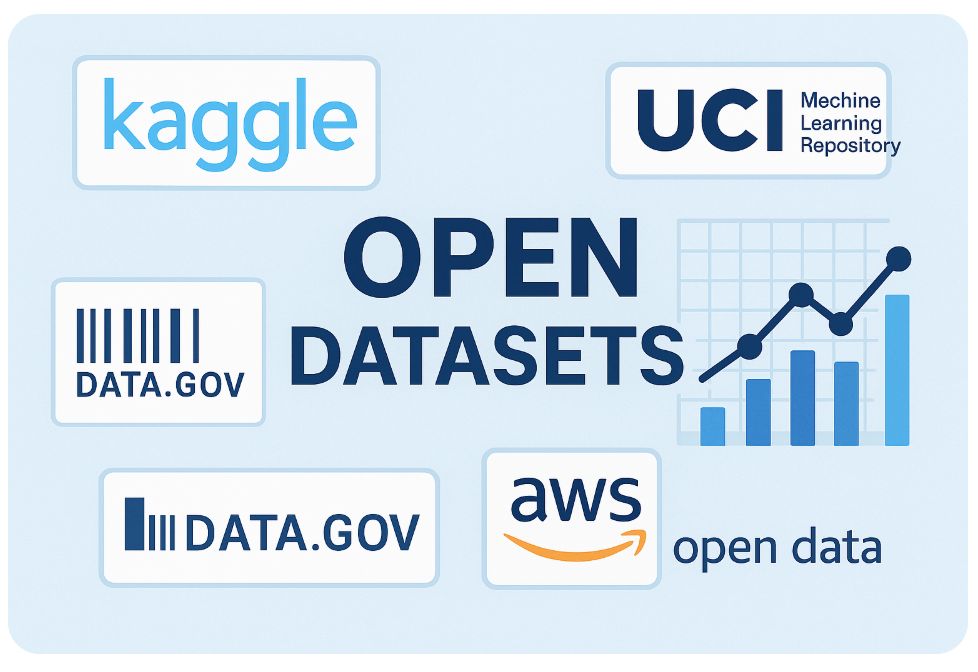
👀 ¿Buscas conjuntos de datos gratuitos para aprender/practicar/crear tu portfolio de #stats#datascience#MachineLearning?
Comparto algunos interesantes:👇🧵
(Comparte y completa la lista)
🔢 ¿Te peleas con las tablas de frecuencia en R?
Hay vida más allá de table() y group_by() + summarise(). 😉
📦 La función tabyl() del paquete janitor crea tablas de frecuencia limpias, legibles y listas para presentar. Se integra genial con flextable(), kable() y tidyverse.👇🧵
🤦🏻♀️ Muchos usan R/RStudio durante años sin conocer esta herramienta... 👀
🎯 Complementos de RStudio (Addins): Extensiones que te permiten ejecutar funciones avanzadas de #RStats con solo unos clics.
Los mejores addins y cómo utilizarlos👇🧵
#dataviz#datascience#posit
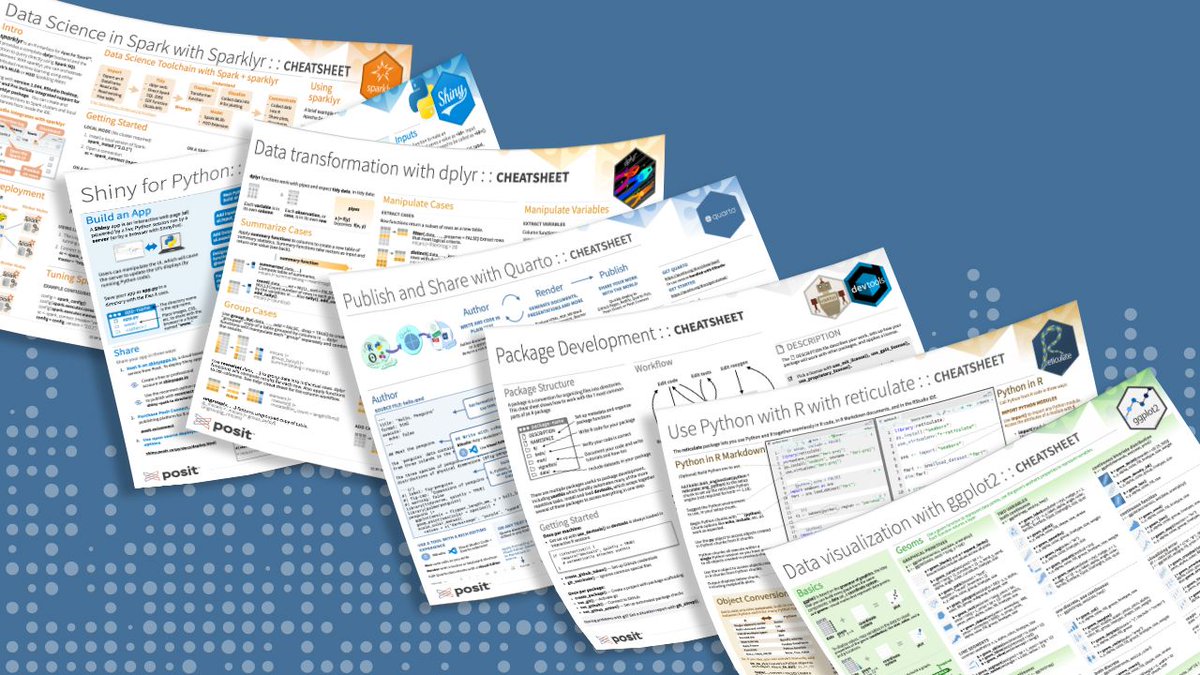
🚀¿Quieres dominar R sin perderte en la documentación?✨
📌Las Posit Cheatsheets son tu mejor aliado para programar con R sin memorizar cada comando. Son resúmenes visuales y prácticos de los paquetes más potentes: ggplot2, dplyr, tidymodels, Quarto... ¡Todo en un solo vistazo!👀