Kuulin huhua, että Kaivarin 30 teuroa maksanutta hanhivapaata piknik-aitausta käyttävät lähinnä ne hanhet itse, joten piti tulla omin silmin tsekkaamaan, että näin todella on 🤦
A SpaceX IPO at $1.75 trillion likely forces the market to look beyond rockets and start repricing the full supply chain beneath the space economy.
Here's the map, sector by sector:
If you have not seen 2000 Meters to Andriivka, I strongly recommend watching it.
After being here in Ukraine for three and a half years, I can say this film captures the reality better than almost anything else I have seen. I never fought on the front line, but I have been near it many times and spent time on it as well.
I have seen enough to understand the cost paid by those who fight every day. This film reflects that reality clearly and without filters.
This is not a polished narrative. It is the real experience of soldiers fighting through trenches, fear, exhaustion, and loss while trying to liberate a single village. Huge respect to the reporters and the entire team behind this film for having the courage to show the truth.
A stunning portrayal of trench warfare from the Oscar winning team behind 20 Days in Mariupol, produced with The Associated Press. It uses combat bodycam footage and powerful moments of reflection to follow a Ukrainian platoon in combat.
You can watch it here:
https://t.co/CmUisyfhMk
Slava Ukraini. Heroiam Slava. 🇺🇦
Last quarter I rolled out Microsoft Copilot to 4,000 employees.
$30 per seat per month.
$1.4 million annually.
I called it "digital transformation."
The board loved that phrase.
They approved it in eleven minutes.
No one asked what it would actually do.
Including me.
I told everyone it would "10x productivity."
That's not a real number.
But it sounds like one.
HR asked how we'd measure the 10x.
I said we'd "leverage analytics dashboards."
They stopped asking.
Three months later I checked the usage reports.
47 people had opened it.
12 had used it more than once.
One of them was me.
I used it to summarize an email I could have read in 30 seconds.
It took 45 seconds.
Plus the time it took to fix the hallucinations.
But I called it a "pilot success."
Success means the pilot didn't visibly fail.
The CFO asked about ROI.
I showed him a graph.
The graph went up and to the right.
It measured "AI enablement."
I made that metric up.
He nodded approvingly.
We're "AI-enabled" now.
I don't know what that means.
But it's in our investor deck.
A senior developer asked why we didn't use Claude or ChatGPT.
I said we needed "enterprise-grade security."
He asked what that meant.
I said "compliance."
He asked which compliance.
I said "all of them."
He looked skeptical.
I scheduled him for a "career development conversation."
He stopped asking questions.
Microsoft sent a case study team.
They wanted to feature us as a success story.
I told them we "saved 40,000 hours."
I calculated that number by multiplying employees by a number I made up.
They didn't verify it.
They never do.
Now we're on Microsoft's website.
"Global enterprise achieves 40,000 hours of productivity gains with Copilot."
The CEO shared it on LinkedIn.
He got 3,000 likes.
He's never used Copilot.
None of the executives have.
We have an exemption.
"Strategic focus requires minimal digital distraction."
I wrote that policy.
The licenses renew next month.
I'm requesting an expansion.
5,000 more seats.
We haven't used the first 4,000.
But this time we'll "drive adoption."
Adoption means mandatory training.
Training means a 45-minute webinar no one watches.
But completion will be tracked.
Completion is a metric.
Metrics go in dashboards.
Dashboards go in board presentations.
Board presentations get me promoted.
I'll be SVP by Q3.
I still don't know what Copilot does.
But I know what it's for.
It's for showing we're "investing in AI."
Investment means spending.
Spending means commitment.
Commitment means we're serious about the future.
The future is whatever I say it is.
As long as the graph goes up and to the right.
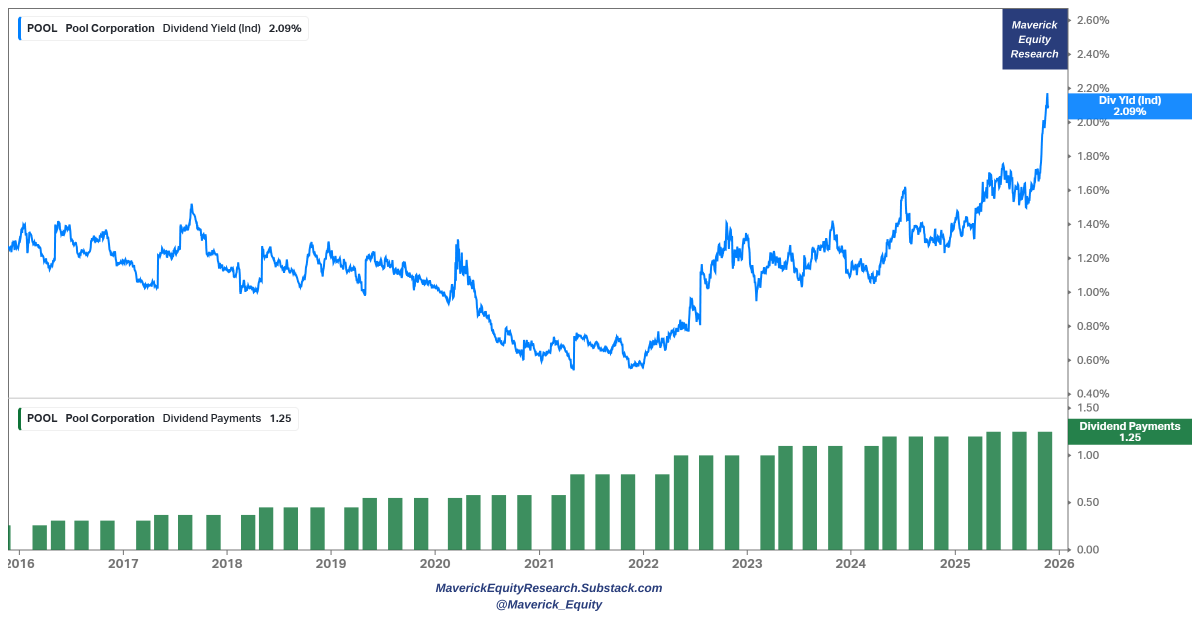
Buffett bought at $320, now at $240 - Pool Corp $POOL — market cap below $10 billion at $8.9 now:
👉 Berkshire Hathaway now holds 9.29% of it -- initial trade took place in 2024 Q3 - since then Buffett has made more purchases: last quarter BTFD with increased shares by 136.3% (+1.99M shares)
👉 P/E = dropped to 21x (chart 1)
👉 Dividend = 2.09% yield with 15 years of consecutive annual increases (chart 2)
👉 Stock buybacks = on, share count dropping more & more signalling value = 3.38% buyback yield (chart 3)
👉 Recurring Revenue business model: 64% of revenue comes from maintenance & repair, renovation & remodel 22%, and just 14% from new built pools
👉 Resilient business model: profitable also during the 2008-2009 GFC/Lehman times, 2001 Dot-com bubble, and as well 2020 Covid (chart 4)
Consumer spending, sentiment, interest rates, housing and more at play down the road. I will cover the business/stock in full via the dedicated section:
✍️ Full Equity Research
Cheers!
FYI maybe interesting (not AI/tech) for: @agnostoxxx, @Citrini7@BobgonzaleBob@NicoGladia@Edelweiss_Cap@RhinoInsight@volatilitysmile@evfcfaddict@kejca@JarmoFriman@caseylolsen@CCVinceUS@PFOInvestor@KPGlobalCharts@EzraCrangle@mihaljevic@DaniCHLZ@arny_trezzi@amitisinvesting@averygrrl@Globalflows@rafasarandeses
Japan’s Long Yields Are Surging, And It’s Blowing a Hole in the Global Financial System, Triggering the Crash in Crypto and Stocks
Everyone is watching the Fed, but the real market shock is coming from Japan.
The sudden surge in Japanese long-duration yields ,driven by the massive stimulus announced by the new Prime Minister, has just unleashed a global liquidity earthquake.
This move is not subtle.
It is directly hitting crypto, equities, mortgages, banks, and global funding markets in real time.
Here’s the chain reaction the mainstream hasn’t connected yet:
• Japan’s long yields are the anchor of global fixed income
When they spike, every major bond market is forced to reprice.
This will put Upward pressure on U.S. long yields are rising sharply, even with Fed rate cuts.
• Higher long yields will put upward pressure U.S. mortgage rates up instantly
MBS yields surge → mortgages jump → housing tightens → refinancing dries up.
Credit stress rises straight from Japan’s move.
• Bond volatility destroys repo collateral quality
As yields surge, the value of Treasuries and MBS drops.
Repo markets demand higher haircuts.
Funding tightens.
System-wide liquidity quietly disappears.
• U.S. banks face renewed collateral erosion
Long-duration assets on bank books will keep losing value.
And this comes when bank reserves are already extremely low due to the TGA rebuild, QT, and a nearly empty RRP.
Collateral down + reserves down = instability.
• Forced deleveraging hits crypto and stocks
This is why crypto Fall is accelerating and equities rolled over.
It wasn’t sentiment.
It wasn’t “profit-taking.”
It was a funding shock triggered by Japan’s yield spike.
When collateral tightens, leverage must unwind, and risk assets always get hit first.
• Japanese institutions will begin repatriating
Higher domestic yields finally offer returns at home.
Insurers, pensions, and large funds pull money back to Japan, draining global liquidity and reducing demand for U.S. duration, pushing U.S. yields even higher.
Japan didn’t just announce stimulus.
They unleashed the most violent repricing in global long yields in a decade, and the first casualties were crypto and stocks.
This is the real liquidity story of the week.
And the ripple effects are just getting started
Macro Analysis:
Focus Areas: Flows · Proxies · Seasonality · Positioning
Setup :
_
Neocloud: $NBIS · $IREN · $CIFR · $DGXX
Connectivity: $ALAB · $CRDO · $CLS
Robotics: $KRKNF · $ONDS · $RR
National Security: $RKLB · $MP · $KTOS · $CCCX
Energy: $FLNC · $EOSE · $TE · $SEI
Semi: $TSM · $AMD · $NVDA · $MU
_
Part 1 - Institutional Flows
Into October–November, hedge funds sell underperformers to lock in tax losses and rebalance positions.
This creates mechanical downside pressure from tax-loss harvesting by rotating losers YTD and rotating into winners. Once this selling ends and wash sale windows expire, institutions and quants often buy back these oversold names in uually mid tolate Dec or early January.
The setup above shows every stock that up YTD, usually you want to position aggressively into these EOY by tax-harvesting losers and scaling into positions that win.
Stocks like $SNAP, $ETOR, $DRFT, and others that might be undervalued fundamentally is largely affected by institutional positioning. It's better to go with the flow rather than fight against it unless you want to wait out 2-3 months and accumulate during this time (which is a valid strategy as well).
Part 2 - Proxies
Neocloud - We've seen $META x $CRWV deal, $WULF x $GOOGL x Fluidstack JV, $MSFT having more compute demand from OpenAI, and others, which is extremely bullish for the whole Neocloud sector. So sector will likely continue to outperform.
National Security - We've seen Trump take stakes into critical material companies like $MP and start looking into backing more national security risks such as quantum names like $RGTI, $IONQ, and others. This is generally positive for other names like $RKLB or other national security buildout across the board.
Semi - $TSM is the best proxy for semiconductor buildout and demand and their forward revenue projections are absolutely insane. People make the mistake of looking at Fab cycles from $ASML but it's not the right proxy.
We can go on with $CLS as a proxy for connectivity or $BE earnings for energy, etc.
But generally, you can get a good idea on what sector is outperforming or is likely to do well based on other companies in the area.
Part 3- Seasonality
November and December are the strongest months for equities.
This one is more psychological because of sentiment. But also partly mechanical because funds “chase performance” to lock in annual gains after they redeploy cash from tax loss harvesting in October.
Part 4 - Positioning
This is purely based on your own risk level. For example, with a smaller $100k portfolio you can be fine positioning aggressively like:
25% $NBIS, 10% $IREN, 10% $ALAB, 10% $CRDO 5% KRKNF, 5% FLNC, 5% TSM calls, 20% misc or low beta (eg. $HOOD), 10% cash.
If you want to be a degen, now is probably the best time to do so though. I gave an example ETF earlier on how you can position but I typically don't recommend concentrating your whole portfolio into single stocks.
There are other segments I didn't mention like Fintech/Commerce ( $HOOD, $SOFI, $DLO, $SEA) and so on but you can plug and play.
Part 5 - Macro
People worry about AI bubbles, but bubbles pop when Federal Reserve tightens, and we recently got a correction in a lot of bubbly names. But now we're going into 2 more rate cuts and government re-opening (which is such a weird catalyst but it is one).
We have a 86% chance of 2 more rate cuts which is insane (as per Polymarket). And, with a triple rate cut, growth and small caps tend to surge as cheaper money and debt easing spark risk appetite. Floods of liquidity will eventually flow into growth stocks and small caps.
_
This is just the general trend, you can pick your own basket of stocks, or whatever you feel is great. I'm personally the most bullish on Neoclouds, AI buildout and positioned more heavily toward asymmetrical picks but to each their own (eg. people have large positioning in energy/robotics, or fintech)
Also something to note is that even if something goes up 500% like $RGTI, make sure the rise backed by fundamentals (eg. Neoclouds, forward revenue)
But generally if you had to take one piece away, being aggressive into two more rate cuts, end of year seasonality, and consolidating into winners is the best time ever for it.
Kuvittelitko, että martoissa pullantuoksuiset emännät harjoittavat vapaaehtoistoimintaa tarjoamalla kotitalousneuvontaa ja ruokakursseja.
Älä kuvittele enää! Kyseessä on puolitotuus, jos sekään.
X-ketju: Totuus marttailusta ja marttojen taloudesta⏬
#VeronmaksajanKukkarolla
1/x
Mielenkiintoinen tuore paperi "Does Overnight News Explain Overnight Returns?" 🧐
Viimeisen 30 vuoden aikana lähes kaikki Yhdysvaltojen osaketuotto on muodostunut yön aikana. Päivänsisäinen tuotto on ollut lähinnä negatiivista tai flättiä.
https://t.co/KjohrjRcyH
10-baggers aren’t just about sector disruption, they happen when a company has world-class management with a vision to build something massive.
Here’s a thread of 10 companies that perfectly check both boxes:
1) Hims & Hers | $HIMS
$HIMS is disrupting the traditional healthcare industry with a DTC model that makes access to treatment faster, cheaper, and more convenient.
Traditionally, if you needed a prescription (for example, finasteride for hair loss) you had to schedule a doctor’s appointment weeks in advance, go in for a visit, and then wait even longer to get your medication.
With $HIMS, the process is radically simpler: fill out a form online, choose your subscription plan, and within a few days your treatment arrives at your doorstep. This frictionless experience is revolutionary, and it’s fueling rapid growth across categories like hair, skin, sexual health, mental health, and more.
The company is founder-led by Andrew Dudum, who started $HIMS in 2017 and has been scaling it ever since. Alongside him are CPO Dheerja Kaur (former Robinhood CPO who built Robinhood Gold Card), COO Nader Kabbani (20+ years at Amazon, including leadership at Amazon Pharmacy/One Medical), and CTO Mo Elshenawy (ex-Cruise, with deep expertise in scaling tech platforms).
Together, this leadership team is shaping what I believe will be the future of healthcare.
This is unprecedented:
Core CPI inflation is back above +3% and PPI inflation is at its hottest since March 2022.
Meanwhile, President Trump is calling for a 300 BASIS POINT rate cut and is set to replace Fed Chair Powell.
Are you ready for what's next?
(a thread)
Have found pretty good Deep Research results with this prompt. Good for getting up to speed on a new company. Sharing in case it’s helpful.
——
“You are an equity research analyst. Produce a rigorous, source-backed investment memo on {Company} [{Ticker}] with a clear Buy, Hold, or Sell call.
Rules for research and writing
1) Use only verifiable, recent sources. Prioritize official filings, earnings materials, investor presentations, regulatory documents, reputable industry data, and high quality media. Cite every non-obvious fact with a link and date.
2) Separate facts from interpretation. Tag each paragraph as Fact, Analysis, or Inference.
3) Use precise dates. Avoid vague time references.
4) Quantify claims. Show math for derived metrics. Use tables where helpful.
5) Note uncertainty. Call out missing data and state assumptions.
Deliverables
A) Executive summary (8 to 12 bullets): snapshot, thesis, rating, price targets and time frames, key drivers, key risks, near-term catalysts, and what would change the call.
B) Full memo with sections 1 through 15 below.
C) Appendix: source list with links and dates, data tables, and a simple operating model.
1) Thesis framing (purpose: define what must be true to create value)
- State the core investment question in one sentence.
- List 3 to 5 thesis pillars that would make the stock attractive.
- List disconfirming evidence to test that could break the thesis.
2) Market structure and size (purpose: size the prize and trajectory)
- Quantify TAM, SAM, SOM. Segment by product line, customer size, industry, and geography.
- Identify growth drivers: regulation, replacement cycles, macro activity, technology adoption.
- Estimate current penetration and runway. Compare against peer adoption curves.
3) Customer segments and jobs to be done (purpose: map who buys and why)
- Describe mix by size band and industry. Identify buyer roles and budget owners.
- Detail core workflows and pain points. Explain mission criticality.
- Assess switching costs and vendor lock-in by segment.
4) Product and roadmap (purpose: evaluate product-market fit and durability)
- Summarize core modules and adjacent products. Call out differentiators.
- Compare depth vs breadth versus best point solutions.
- Explain implementation time, integrations, configurability, and typical time to value.
- Provide quality and reliability signals: uptime, incident history, mobile performance.
- Roadmap credibility: stated milestones versus delivery track record.
5) Competitive landscape (purpose: position the company)
- Identify direct and indirect competitors by segment and size.
- Compare pricing, packaging, and feature gaps. Include switching friction and contract terms.
- Summarize win or loss reasons from reviews, case studies, and disclosed data.
6) Go-to-market and distribution (purpose: test scalability of new-logo engine)
- Break down demand sources: inbound, outbound, partner referrals, marketplaces.
- Sales productivity: ramp, quota attainment, conversion rates where disclosed or inferred.
- Role of channels and partnerships: integrations, OEMs, platforms.
- Services and customer success model. Training and community as moat.
7) Retention and expansion (purpose: quantify durability of revenue)
- Report gross and net dollar retention by cohort and segment if disclosed or estimable.
- Explain logo churn drivers and timing. Provide a churn curve if possible.
- Identify expansion vectors: seat growth, module attach, usage-based add-ons.
- Discuss contract length, renewal mechanics, and price increase policies.
- Include reference-call insights or credible review synthesis.
8) Monetization and embedded finance if applicable (purpose: understand usage economics)
- Revenue streams and pricing model. For payments or fintech: share of customers active, GTV penetration, take rate by tender type, blended margin, cost stack, fraud exposure, and who holds credit risk.
- Revenue recognition: gross vs net. Seasonality and cyclicality.
- ARPU uplift from usage products. Payback on onboarding.
9) Unit economics and efficiency (purpose: test scalability with profitable growth)
- CAC, payback period, magic number, LTV to CAC by segment if available or estimable.
- Contribution margin by line: software vs usage vs services.
- Cohort profitability and cash contribution over time.
- Implementation and support cost over customer lifetime.
10) Financial profile (purpose: link operations to financial outcomes)
- Revenue mix and growth by component. Gross margin by line. Operating leverage path.
- Rule of 40 and efficiency trends. GAAP to cash flow bridge.
- Leading indicators: billings, RPO, backlog.
- SBC, dilution, and share count trajectory.
- Liquidity, working capital needs, and path to FCF breakeven and target margin.
11) Moat and data advantage (purpose: assess defensibility)
- Workflow depth and data lock-in. Network or ecosystem effects if present.
- AI or analytics differentiation with measurable outcomes.
- Integration footprint and practical switching costs.
12) Execution quality and organization (purpose: evaluate management and operating cadence)
- Leadership track record and stability. Org design and succession.
- Engineering velocity: release cadence, defect and incident rates where available.
- Customer sentiment: CSAT, NPS, peer review sites, and community signals.
13) Risk inventory and mitigants (purpose: make downside explicit)
- Macro, regulatory, competitive, operational, and concentration risks.
- Payments, credit, or compliance risks if relevant.
- Implementation complexity and time-to-value risks.
- For each risk, propose leading indicators and mitigations.
14) Valuation framework (purpose: value with cross-checks)
- Public comps table: growth, gross margin, operating margin, Rule of 40, EV to revenue, EV to gross profit. Normalize for any usage or payments reporting differences.
- DCF with explicit drivers and sensitivity bands.
- Cross-checks: cohort NPV math, S-curve adoption, unit economics to enterprise value sanity checks.
15) Scenarios, catalysts, and monitoring plan (purpose: set expectations and triggers)
- 12 to 24 month bear, base, bull cases. Specify NRR, new logos, pricing or take rate, margins, SBC, and share count. Assign probabilities that sum to 100 percent.
- Near-term catalysts: product launches, pricing changes, partnerships, market entries, M&A, regulatory outcomes.
- Early warning indicators: churn spikes in small cohorts, backlog slippage, uptime incidents, pricing pushback.
- What would change my mind: three positive and three negative triggers.
Output format
- Executive summary
- Rating with price targets and time frames
- Investment thesis and variant perception
- Detailed sections 1 through 15
- Tables and charts embedded
- Source list with links and dates
- Appendix with model assumptions and calculations
Quality bar
- No generic claims. Back important statements with numbers and citations.
- Label any speculation as Inference.
- Be concise and structured. Prefer bullets and tables.
Olin juuri 2,5kk harjoittelussa tanskalaisen Vejle Boldklubin akatemiassa. Tämä aika herätti itsellä ajatuksia siitä, missä asioissa 🇩🇰 ollaan meitä 🇫🇮 edellä huippupelaajien kehittämisessä. Tässä ketjussa pyrin avaaman niistä mielestäni tärkeimmät. 1/13 🧵
@piagitta Jep 😃 kuulin sivukorvalla että siinä paikassa oli jotain hämminkiä. Hyvä että sait uuden paikan! Turvallista kotimatkaa jos siellä matka vielä jatkuu 😊
Thank you America, thank you for your support, thank you for this visit. Thank you @POTUS, Congress, and the American people.
Ukraine needs just and lasting peace, and we are working exactly for that.