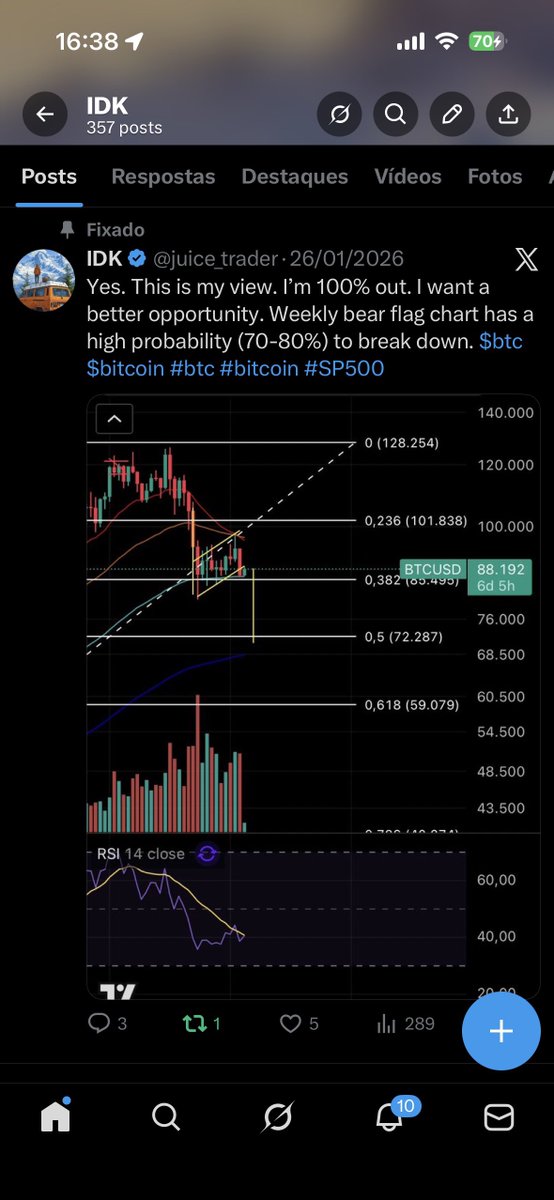
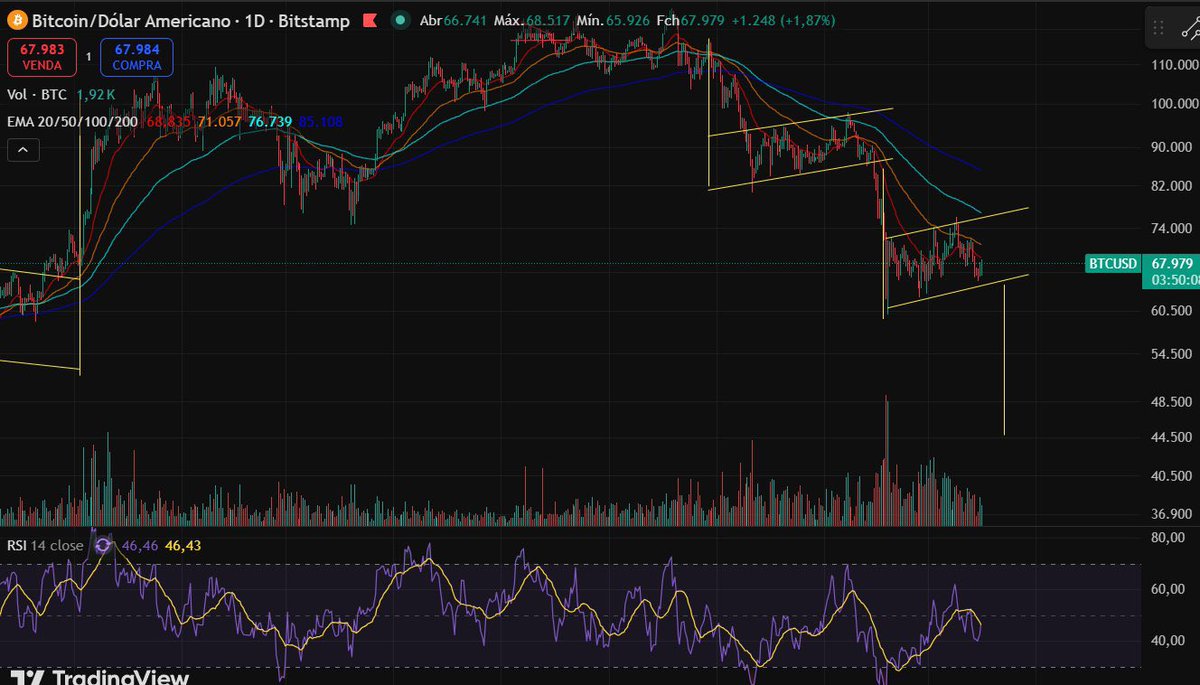
Yes. This is my view. I’m 100% out. I want a better opportunity. Weekly bear flag chart has a high probability (70-80%) to break down. $btc $bitcoin #btc#bitcoin#SP500
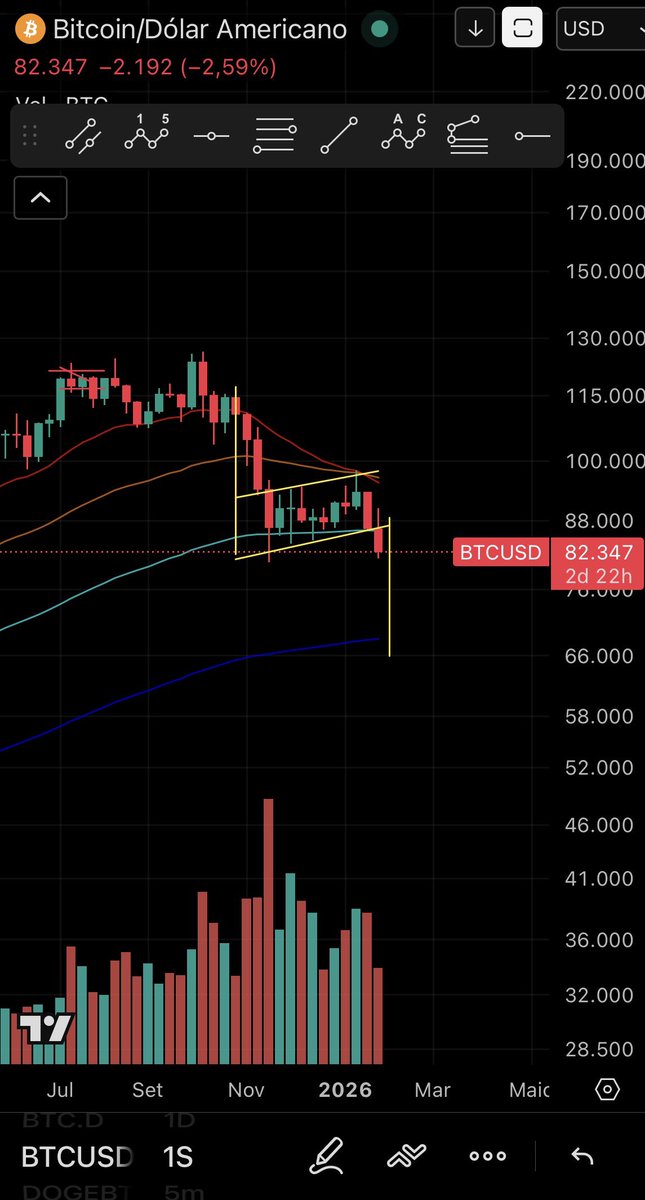
Bitcoin lost the 81k region on the weekly chart and broke through several key moving averages.
With this structure, price may now look for the next Fibonacci support zones: 0.5 (70k) and 0.618 (57k).
Meanwhile, I’m watching closely for a possible RSI divergence ,mainly on the daily, and if it shows up on the weekly, even better.
$btc $bitcoin #btc #bitcoin
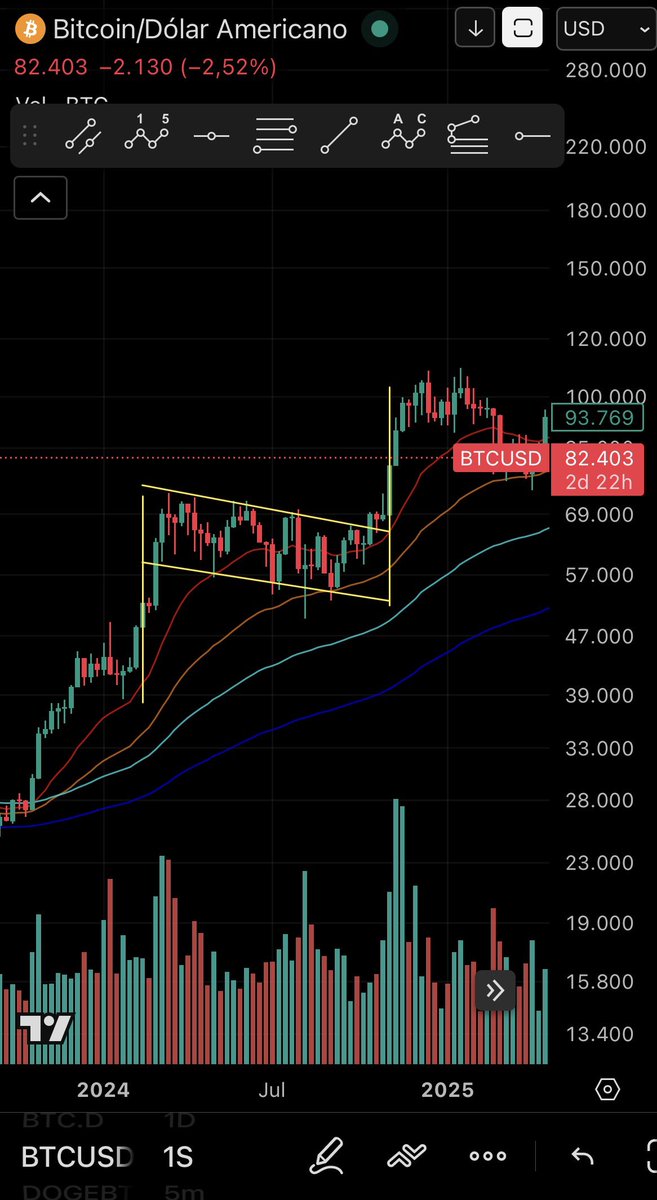
This is what you need to know:
On the BTC weekly chart, both the bull flag and the bear flag follow the same logic: a strong pole followed by a consolidation. That pole matters because it’s used as the projection for the next move. In a bull flag, a breakout often repeats the leg up. In a bear flag, the breakdown usually mirrors the leg down. That’s why these structures on the weekly are so important , they show the direction and even hint at how far the price can go.
#btc #bitcoin
Yes. This is my view. I’m 100% out. I want a better opportunity. Weekly bear flag chart has a high probability (70-80%) to break down. $btc $bitcoin #btc#bitcoin#SP500
Be patient. Bitcoin is in no rush. Don’t try to catch a falling knife or you’ll get hurt. Take your time: wait, breathe, analyze, stay calm, and pay attention to the signals. And above all, be careful with leverage. Stay calm and go do something else for a while. Clear your head with a hobby instead of stressing yourself out.
#btc #bitcoin $btc $bitcoin
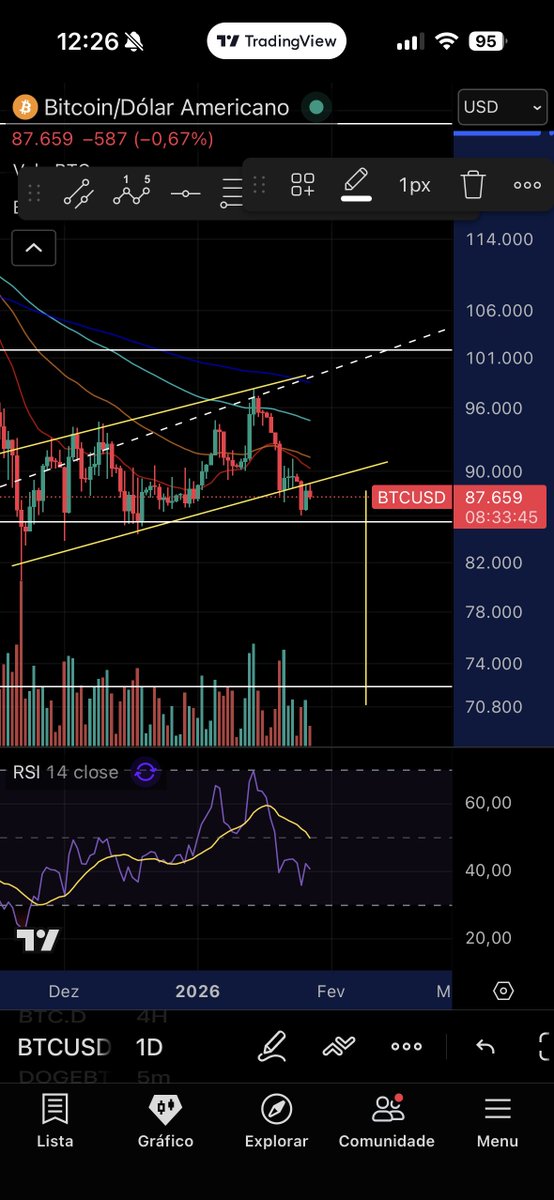
Bitcoin lost the 81k region on the weekly chart and broke through several key moving averages.
With this structure, price may now look for the next Fibonacci support zones: 0.5 (70k) and 0.618 (57k).
Meanwhile, I’m watching closely for a possible RSI divergence ,mainly on the daily, and if it shows up on the weekly, even better.
$btc $bitcoin #btc #bitcoin