Why is bitcoin not pumping?
Because 50% is selling (OGs traumatized by 2021, technical investors looking at RSI, 4y cycle fans expecting a bear 2y post halving) while the other 50% is buying (fundamental investors, tradfi, banks).
Epic battle ... until sellers are out of ammo.
Announcing the Zama Public Auction.
We’re selling 10% of the $ZAMA supply via a sealed-bid Dutch auction on Ethereum, using the Zama Protocol itself to keep bids confidential with FHE.
Why this matters:
◼️ Fair distribution & real price discovery
◼️ No bot sniping or gas wars
◼️ Tokens are unlocked immediately
🗓️ Auction: Jan 12–15
🗓️ Claim: Jan 20
$ZAMA is the utility token of the Zama Protocol, a confidentiality layer for existing L1s/L2s:
◼️ Pay encryption & decryption fees
◼️ Stake or delegate to operators
◼️ Help secure FHE coprocessors & KMS nodes
Mainnet is expected to launch by year-end, with $ZAMA fully functional before the auction.
Get notified at launch: https://t.co/sOTkQX67Cl
this is an absolutely crucial chart showing the deep interconnection between crypto liquidity and global forex macro trades.
the correlation between $btc's dip and $usdjpy's drop is a classic signal of yen carry trade unwinding.
here is the valuable breakdown of why the bank of japan (boj) is hitting bitcoin:
1. the yen carry trade: for years, traders have borrowed the japanese yen (jpy) at near-zero interest rates to buy higher-yielding assets, including u.s. treasuries, tech stocks, and, crucially, risk assets like bitcoin and high-yield altcoins. this strategy is the "yen carry trade."
it requires a weak jpy (high usdjpy).
2. the boj pivot: when $usdjpy falls, as it does sharply on your chart, it means the japanese yen is strengthening.
this happens because the market is suddenly pricing in the boj ending its ultra-loose monetary policy and raising rates (a "hawkish" move).
this potential rate hike makes the yen borrowing more expensive.
3. unwind: when the cost to borrow jpy goes up, carry traders are forced to quickly close their positions.
they sell the asset they bought (bitcoin) to raise the dollars needed to buy back the yen they owe. this creates massive, sudden, and non-fundamental selling pressure on bitcoin, which perfectly matches the synchronized drop shown on your chart.
the level: the fact that the boj is rumored to be hawkish at the $155-$160 usdjpy range means they are no longer tolerant of a cheap yen.
the dramatic drop from $156+ shows the market reacting to this hawkish sentiment.
this means that today's selling pressure is not an institutional flow issue (like the etf outflows), but a global deleveraging event triggered by a central bank.
it is a short-term, but violent, external shock.
the trade here is to recognize that this is a forced, mechanical liquidation.
once the carry trade positions are sufficiently cleared (which the $573m liquidation from earlier confirms is happening), the price can recover aggressively.
the immediate question is: will the anticipated fed dovishness (qt ending today) be enough to counteract the tightening effect of the boj's hawkish rumors, or will the carry trade unwinding dominate the market until the actual boj decision in december?
The million dollar question:
What is happening crypto right now?
Crypto markets have now officially erased over -$1 TRILLION of market cap since October 6th.
But why?
The answer to this question seems to be more technical than fundamental.
That is, crypto adoption is still at record highs, de-regulation is in full swing, and technology is advancing rapidly.
However, leverage is at unprecedented levels which is amplifying moves in the market, such as the $20B liquidation seen on October 10th.
As a result, when uncertainty arises or technical momentum fades, downward swings are amplified.
300,000 traders are being liquidated PER DAY on average and the market has evolved into its most reactive form in history amid Trump posts and headlines.
The long-term thesis is stronger than ever, but the short-term picture points to larger swings in both directions.
Leverage is a wild "drug."
While you're still in the Drinks/CPG vertical, you guys are carving out your own lane.
I also have a similar outlook on Rekt.
I'm not focusing on $Rekt and if people think 500m or 2b mcaps are big, they're not thinking big enough.
@RektBrands has the opportunity to become something huge. They can become a symbol for consumer empowerment and cultural participation.
What we are seeing right now is V1. A brand in its infancy stages with record breaking metrics and unparalleled brand affinity.
What will happen when serious growth comes. New products, new markets, 10-100x in volume for drinks, new activations, partnerships, exponential increase in consumers that turn into loyal brand ambassadors.
That's just the traditional side, now add the value exchange that comes from $Rekt. Will be like nothing we've seen before.
So yes, I'm thinking bigger, much bigger.
This is web3 disrupting industries. How it should be!
Wishing you and the team the very best and know that I'm here to support in any way.
BREAKING: US markets accelerate losses as Fed Chair Powell pushes back on rate cut hopes.
“Higher for longer” and a global trade war, the perfect combination for historic volatility.
Did Google Create a Quantum Computer That Breaks Blockchain Security?
TL;DR: No. While the research results are impressive, we're still far from breaking modern cryptography.
A thread. 🧵
https://t.co/ZeMYIp7BuI
US money supply growth is accelerating:
M2 money supply rose +3.9% year-over-year in January, the fastest pace in 30 months.
This is the 11th straight month of money supply expansion.
The amount of US Dollars in circulation has reached $21.6 trillion, just $16 billion below an all-time high set in April 2022.
Meanwhile, global money supply has risen by ~$2.0 trillion over the last 2 months, to its highest since September 2024.
Money supply is expanding again.
Last cycle all my friends became millionaires
But most of them lost 90% of their portfolio
I spent 2 Bull Runs to create a list of rules
Knowing these 18 rules meant your assets is 100% safe👇🧵
You guys all need to learn patience...
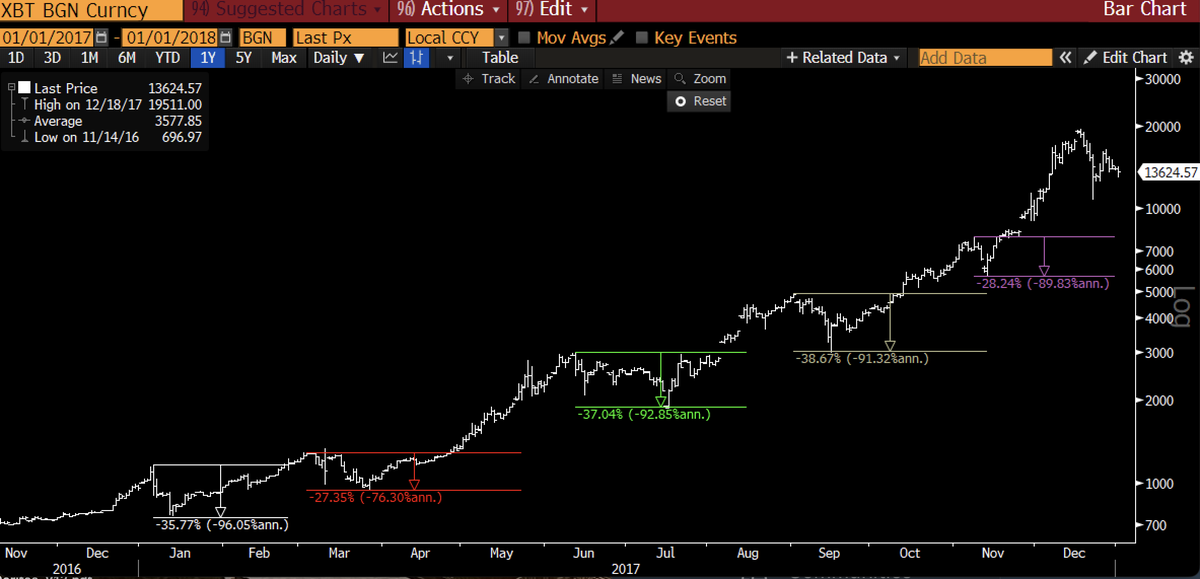
This was 2017. Very similar macro structure:
5 x 28%+ pullbacks in BTC
Most lasted 2 to 3 months before a new high
Alts saw 65% corrections.
All were noise.
Go do something else more constructive than stare at the screen.
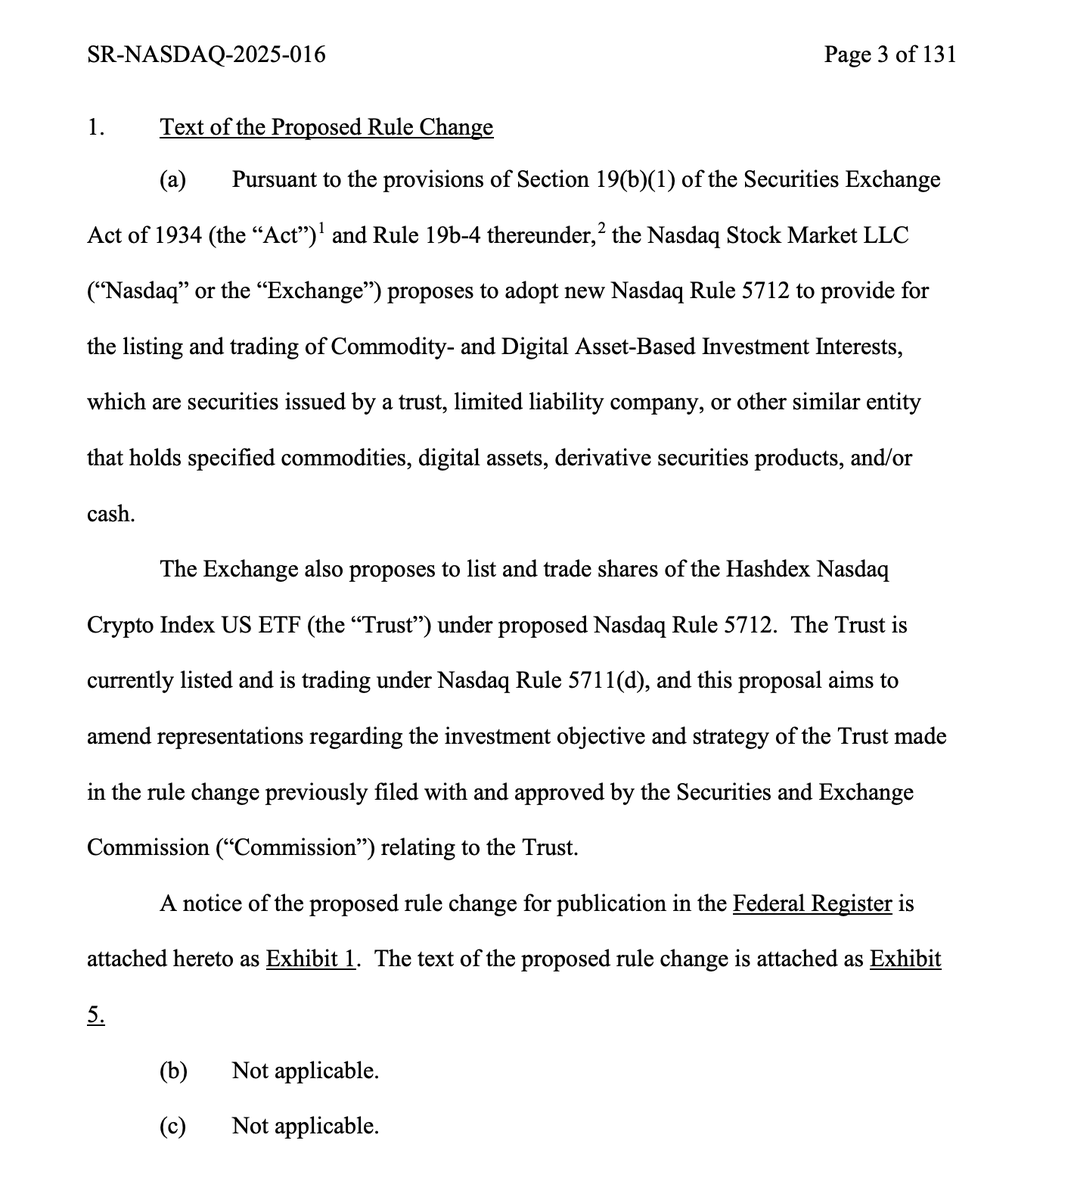
ETF News: The race is on to be the first to list an ETF with digital assets other than $BTC and $ETH as @hashdex propose using new @Nasdaq Rule 5712 introduced YESTERDAY, to list their basket Fund @hashdex Nasdaq Crypto Index ETF on the #NASDAQ exchange.
https://t.co/eXxLXKmC7m
Current composition of the index attached:
$BTC 72.7%
$ETH 14.48%
$XRP 5.02%
$SOL 4.78%
$ADA 1.5%
$LINK 0.51%
$AVAX 0.37%
$LTC 0.37%
$UNI 0.27%
Understanding the implications of the #Solana strategy and why the competition are trying everything to stop it.
- #Solana processes 90% of daily blockchain transactions (including Bitcoin)
- #Solana will transact 90% of Stable Coin transactions estimated to be $1 trillion by 2028
- #Solana volume and revenue are running away from all other chains combined.
- #Solana ETFs in Europe already allow the issuer to stake the $SOL and pay the ETF shareholder a hefty dividend based on volume.
- #Solana US ETFs will be one of the greatest dividend paying shares ever in history which will scale up on Stable Coin adoption.
Ethereum and Bitcoin ETFs cannot compete with the dividend from a #Solana ETF.
This is the underlying arms race in motion.
The entity that bought $5M of LIBRA just now is connected to the entity that sniped $1M of TRUMP in the first block of its launch.
This entity sniped $1M+ of TRUMP as soon as it launched on the address 6QS. All of this TRUMP was distributed to 5CP, which then split TRUMP between several addresses that sold TRUMP for a large profit.
One of these addresses receiving TRUMP from 5CP purchased $5M of LIBRA as soon as Javier Milei retweeted the “How to buy LIBRA” post this afternoon.
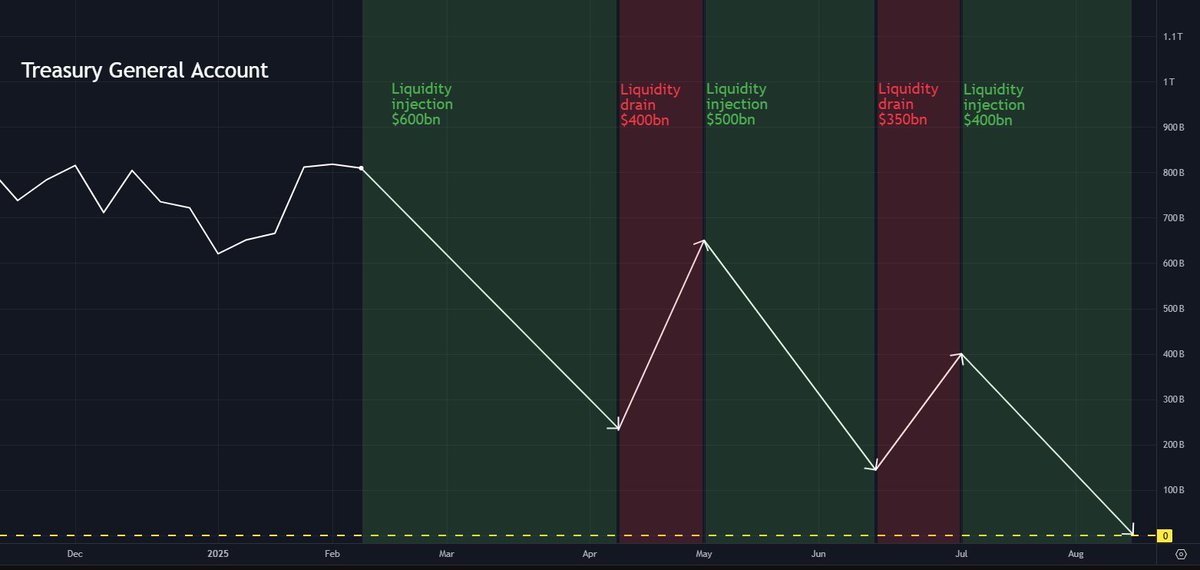
💵 "Not QE, QE" has officially started
A liquidity injection that could total up to $842bn from the US Treasury General Account began this week.
Functionally, this is similar to Quantitative Easing, but on a temporary basis.
Here's everything that is happening, in simple terms...
From my understanding, the official "debt ceiling-induced" Treasury General Account (TGA) drawdown began on Wednesday February 12.
As the US Government's $36 trillion debt limit is now binding, the Treasury cannot issue "new" debt.
So, it is being forced to use cash from the TGA to fund spending.
This is a liquidity injection, flooding the market with "new" liquidity and pushing up bank reserves.
This train is now in motion and will not stop until lawmakers come to a new debt ceiling agreement (probably involving raising or suspending the ceiling).
On Tuesday February 11, the TGA balance stood at $842bn.
So, the potential maximum length of the train tracks is $842bn.
My rough estimated path for the train is this:
I estimate the first "portion" of this drawdown will see a liquidity injection in the region of $600bn between February 12 and April 11, before taxes will temporarily fill up the TGA.
However, the most important metric to follow to determine any potential impact on markets is the "net" liquidity injection from all Federal Reserve sources.
This will very likely will be lower than $600bn.
For two reasons:
1⃣ QT continues
The Federal Reserve is continuing with its Quantitative Tightening regime.
This continues at a pace of roughly $55bn per month.
This is a liquidity drain, as the Fed allows assets on its balance sheet to mature without reinvesting the proceeds, effectively shifting them back to the market to absorb.
I think it is unlikely the Fed will stop QT at the next FOMC meeting on March 19.
So, the total liquidity drain from QT will probably be roughly $110bn over the duration of this first portion of the TGA drawdown.
2⃣ Reverse Repo usage may increase
Due to the debt-ceiling dynamics and the rules the Treasury must follow, we are likely to see "net negative T-bill issuance".
This means the Treasury will issue fewer T-bills than previously planned, reducing the overall supply available to the market.
The Treasury has already begun to trim supply of bills auctions.
If the debt-ceiling deadlock persists, T-bill issuance will likely continue to decline, making bills increasingly scarce.
This may incentivize money market funds to park cash in the Fed's Reverse Repo, potentially pushing this chart up, or least stalling its downward momentum.
Reverse Repo usage increasing would be a liquidity drain, as money would be moving away from markets and into the Reverse Repo facility at the Fed.
So, watching the Reverse Repo will also be key to determining the "net" liquidity injection from Federal Reserve sources.
The total "net" liquidity injection will be reflected in the chart below.
This chart increased by around $50bn this past week.
I'll continue to post updates here on X.
🤔 When will a new debt ceiling agreement be reached?
It doesn't look like a resolution to the debt ceiling showdown will be coming anytime soon.
On Wednesday, House Republicans offered up a plan to enact trillions of dollars in tax cuts and raise the debt ceiling.
Passing this measure will be tough however, given the Republicans' fractious and narrow majority.
Democrats are expected to be unified in opposition.
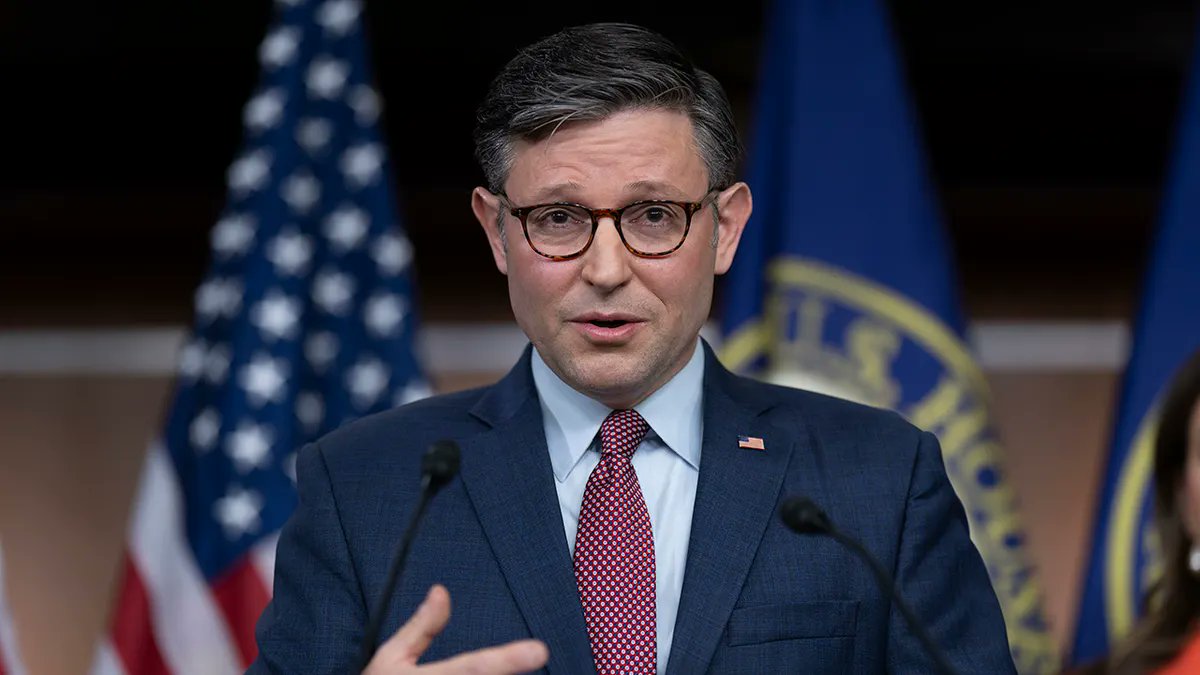
This comes down on the shoulders of House Speaker Mike Johnson, as he attempts to rally lawmakers behind the plan.
The problem is that a relatively large group of very conservative Republicans are opposed to raising the debt ceiling on principle and have never voted to support an increase.
Their leaders have made the point that even a call from the President won’t sway some of these members.
Previous debt ceiling increases have required bipartisan support.
If you’re in AI, pivot to crypto…
…just kidding.
You should do both.
Work in AI, but save in Bitcoin.
Because Bitcoin may hold value even when nothing else does.