I write at the intersection of statistics and finance, climate risk, credit and market risk, regulation, and insights from both theory and real-world experience
Is your training data truly representative?
I just published a new article on Towards Data Science showing how to measure data representativeness with PSI and Cramér’s V in Python.
Read it here: [https://t.co/AUUPadz88u]
Tagging @TDataScience
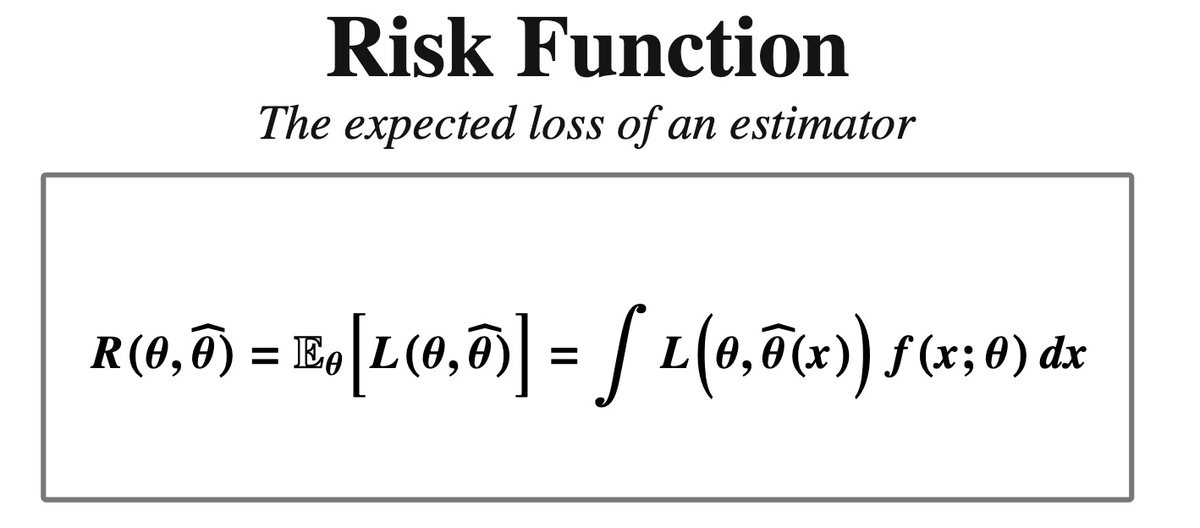
An estimator is a function of the data. Before we observe the sample, the estimator is random.
After we observe the sample, we get one value of that estimator. A loss function measures the gap between the parameter we want to estimate and the estimate we get.
To evaluate an estimator, we do not look only at one error. We look at its average loss. This average loss is called risk.
𝗥𝗶𝘀𝗸 𝗺𝗲𝗮𝘀𝘂𝗿𝗲𝘀 𝘁𝗵𝗲 𝗮𝘃𝗲𝗿𝗮𝗴𝗲 𝗲𝗿𝗿𝗼𝗿 𝗼𝗳 𝗮𝗻 𝗲𝘀𝘁𝗶𝗺𝗮𝘁𝗼𝗿.
𝗧𝗮𝗻𝗵 𝗔𝗰𝘁𝗶𝘃𝗮𝘁𝗶𝗼𝗻 𝗙𝘂𝗻𝗰𝘁𝗶𝗼𝗻 The sigmoid function maps any input x to a value between -1 and 1:
σ(x) = (eˣ - e⁻ˣ) / (eˣ+ e⁻ˣ)
It is commonly used in hidden layers of neural networks but can lead to vanishing gradient problems in deep networks.
𝗦𝗶𝗴𝗺𝗼𝗶𝗱 𝗔𝗰𝘁𝗶𝘃𝗮𝘁𝗶𝗼𝗻 𝗙𝘂𝗻𝗰𝘁𝗶𝗼𝗻
The sigmoid function maps any input x to a value between 0 and 1: σ(x) = 1 / (1 + e⁻ˣ) It is used in binary classification. In deep networks, it can cause vanishing gradients.
Clear and concise, @jumbong_junior's new credit modeling tutorial explains how to build a scoring grid using logistic regression. https://t.co/SbUz1Tb1EO
Clear and concise, @jumbong_junior's new credit modeling tutorial explains how to build a scoring grid using logistic regression. https://t.co/SbUz1Tb1EO
Before you build a final scorecard, you need to choose the right model.
That is the focus of my previous @TDataScience article.
It explains the model selection step and gives the background needed for my next article on building the final scorecard.
"The goal of this article is to present a clear methodology for training several scoring models, comparing their performance, assessing their stability, and selecting a final model based on statistical, business, and operational criteria."
Don't miss @jumbong_junior's latest credit-score modeling deep dive. https://t.co/rmVAlMnRrG
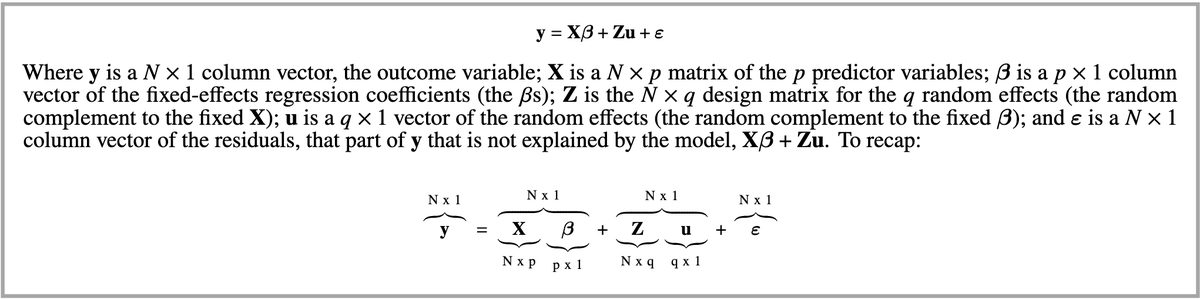
When data scientists talk about predictive modelling, they seem to ignore generalized linear models (GLMs) and generalized linear mixed models (GLMMs).
This is a very bad oversight, because they are powerful tools that can model a variety of target variables, incorporate dependence structures between observations, and offer interpretable regression coefficients.
The mathematical theory behind these models is firmly established, and there are many books and computational packages for them.
Before you jump to neural networks or support vector machines, consider using GLMs or GLMMs. I like learning about these topics from a website called “Statistical Methods and Data Analytics”. It is provided freely by the UCLA Office of Advanced Research Computing at the University of California, Los Angeles (UCLA).
#math
#analytics
#statistics
#regression
#datascience
#dataanalysis
#mathematics
#dataanalytics
#appliedstatistics
#machinelearning
#dataandanalytics
#regressionanalysis
#predictiveanalytics
#predictivemodeling
#predictivemodelling
#regressionmodeling
#regressionmodelling
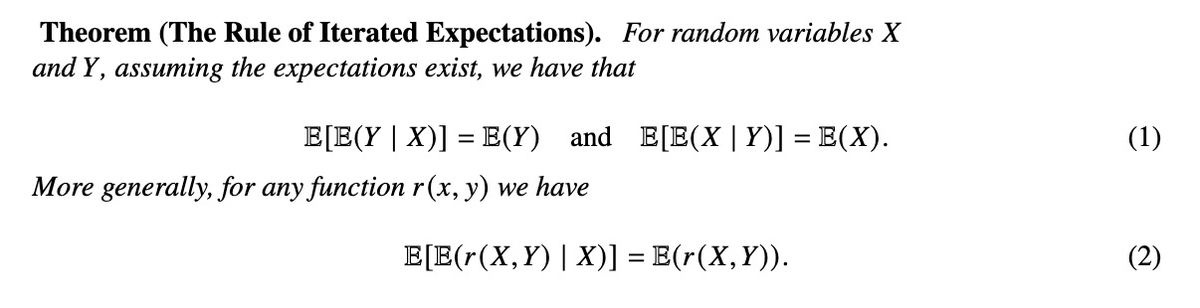
Let X and Y be random variables.
How do you compute 𝔼(Y) when Y depends on X?
The obvious answer: compute the full distribution, then integrate.
But there is a simpler way.
𝗧𝗵𝗲 𝗥𝘂𝗹𝗲 𝗼𝗳 𝗜𝘁𝗲𝗿𝗮𝘁𝗲𝗱 𝗘𝘅𝗽𝗲𝗰𝘁𝗮𝘁𝗶𝗼𝗻𝘀 tells you:
First condition.
Then average.
Let X and Y be random variables.
How do you measure if they move together?
The obvious answer: covariance.
But covariance has one problem:
its value depends on the units of X and Y.
That’s why we use correlation.
Covariance tells you the direction.
Correlation tells you the standardized strength.
The trick:
Correlation is just covariance after removing the units.
Follow me for simple explanations of statistics, probability, and machine learning.
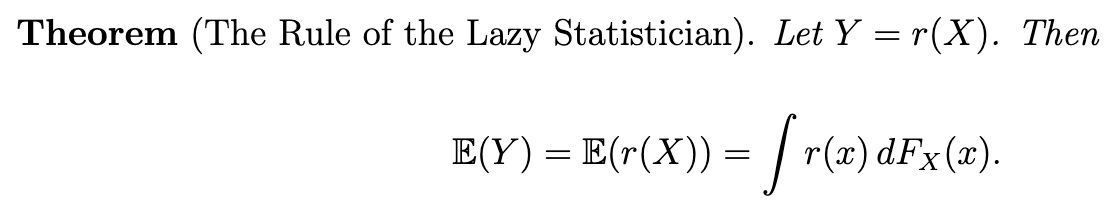
Let Y = r(X). How do you compute 𝔼(Y)? The obvious answer: find the distribution of Y, then integrate. But there is a simpler way.
𝗧𝗵𝗲 𝗟𝗮𝘄 𝗼𝗳 𝗧𝗵𝗲 𝗨𝗻𝗰𝗼𝗻𝘀𝗰𝗶𝗼𝘂𝘀 𝗦𝘁𝗮𝘁𝗶𝘀𝘁𝗶𝗰𝗶𝗮𝗻 tells you:
@getbarkley@TDataScience Great point @GetBarley. Most scoring models compare a borrower to a population. But a borrower can look normal relative to the cohort while quietly drifting from their own baseline. That is a different problem, and one worth building a dedicated framework for.
Most credit scoring models fail not because the math is wrong, but because the wrong model is selected.
In my latest article in @TDataScience, I use Codex as a programming assistant to build a methodology that selects the most stable and robust model for scoring retail counterparties at a bank.
In a new installment of his ongoing series on credit-score modeling, @jumbong_junior patiently walks us through a structured methodology for comparing candidate models, testing stability, and selecting a robust final score. https://t.co/FH8TT6B81a
⚽️ | The Goldman Sachs prediction model for the FIFA World Cup is out:
🇪🇸 Spain: 26%
🇫🇷 France: 19%
🇦🇷 Argentina: 14%
🇧🇷 Brazil: 8%
🏴England: 5%
Can we trust?
In a new installment of his ongoing series on credit-score modeling, @jumbong_junior patiently walks us through a structured methodology for comparing candidate models, testing stability, and selecting a robust final score. https://t.co/FH8TT6B81a
Do you ever forget the general definition of a quantile for a random variable? Not just for continuous random variables, but for discrete ones as well.
For a probability level q, the quantile is defined as the smallest value x such that the cumulative distribution function F(x) is greater than or equal to q:
The ESG framework as we once knew it — Environment, Social, and Governance—appears to have faded from the spotlight.
But make no mistake: the risks have not disappeared. What has changed is the language we use to describe them.
We have quietly shifted to a new paradigm, one that is more aligned with today's geopolitical and macroeconomic realities.
The acronym ESG still holds, but with a fundamentally different meaning:
E for Energy: energy sovereignty, security of supply, and the strategic dimensions of the energy transition.
S for Security: cybersecurity, supply chain resilience, and operational continuity.
G for Geopolitics: exposure to international tensions, strategic dependencies, and the risks of a fragmenting global order.
The substance has not changed. The framing has.
In credit scoring, raw variables are not always enough.
The real value often lies in transforming them into stable, interpretable risk classes.
This article on @TDataScience explains why categorization is a key step in credit scoring and how it helps build more robust scorecards.
https://t.co/UK2BcLs1c0