I spent 10+ years as an Executive Assistant.
Organised everything. Managed everything. Understood the business deeply.
But I couldn't answer one question: what does the data actually say?
So in January 2026, I decided to find out. 🧵
19 weeks in.
3 portfolio projects. All live on GitHub. 🎉
US Sales.
Brazilian E-Commerce.
Marketing Funnel.
Excel. SQL. Power BI. Python.
The portfolio is real.
#jumoke_data#DataAnalytics#GitHub
Week 18
Portfolio Project 3✅
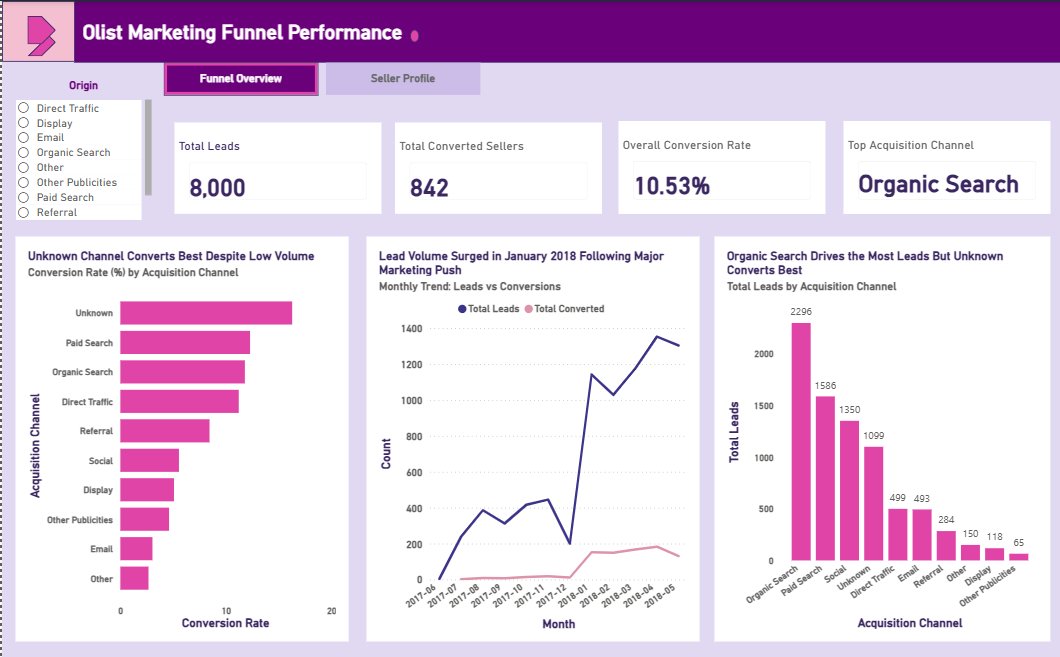
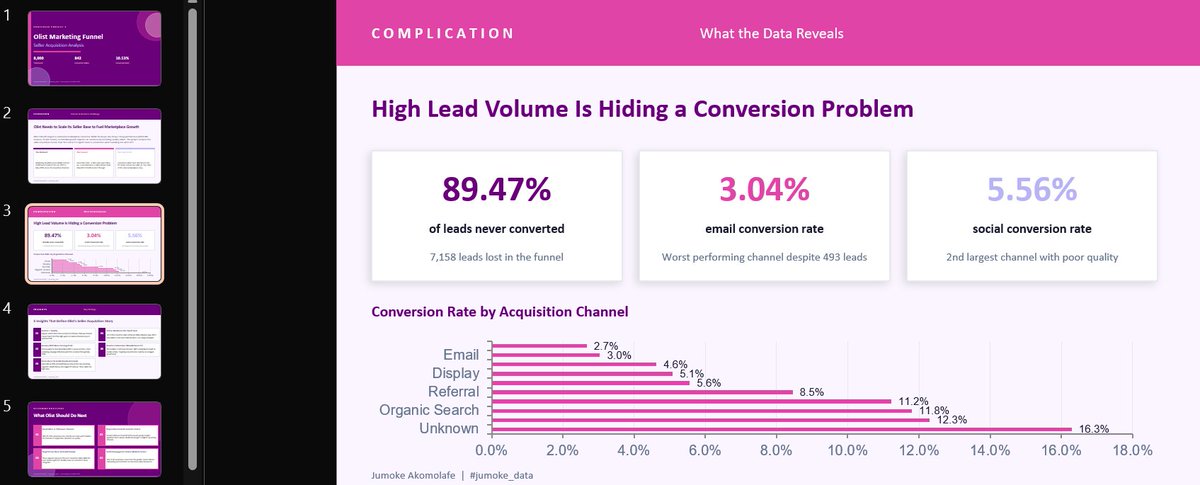
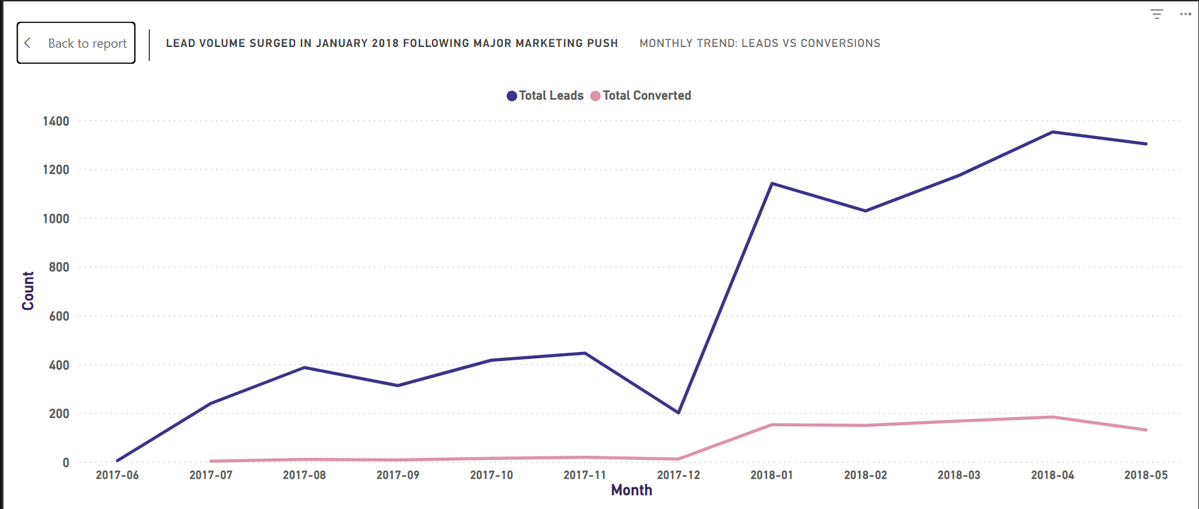
Olist had 8,000 seller leads. Only 842 converted.
The channel with the LEAST leads? Highest conversion rate (16.29%).
Volume is not quality.
Full breakdown: Python | SQL | Power BI
GitHub: link in bio
#jumoke_data#DataAnalytics#PowerBI#Python
Week 17
Portfolio Project 2: done. 🎉
3 days planned. 7 days actual.
Excel + SQL + Power BI + SCR presentation -- 8 Olist datasets.
Headline number looks great. Delivery data tells a different story.
P3 is next. Python joins the stack.
#jumoke_data#DataAnalytics#PowerBI
Week 16 done! P1 Power BI dashboard complete.
Excel felt fast. SQL felt fast. Power BI humbled me. Past 3am sessions, formatting battles, figuring things out alone.
Worth it.
17,992 rows. 5 DAX measures. 4 insight-based charts.
Still building. #jumoke_data#PowerBI
@veraherself 🤣🤣🤣...
My dear, SQL dealt with me ehn, so much so that I began to question my life-decisions. Is Data analytics really for me?!🤣
One step at a time, and you will get a complete hang of it for sure.
SQL must bow to us o. Not the other way round.😉
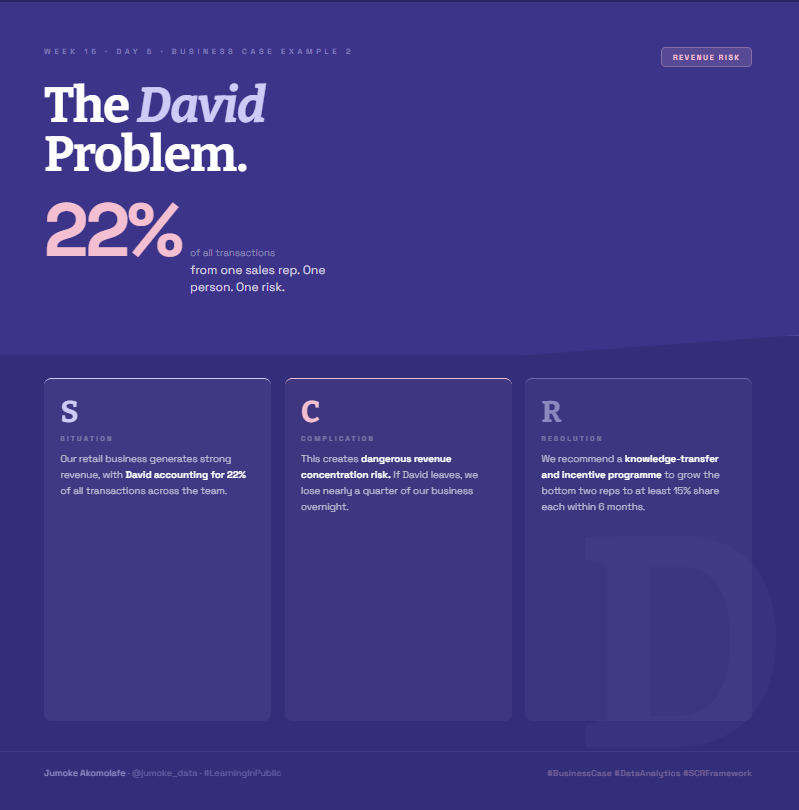
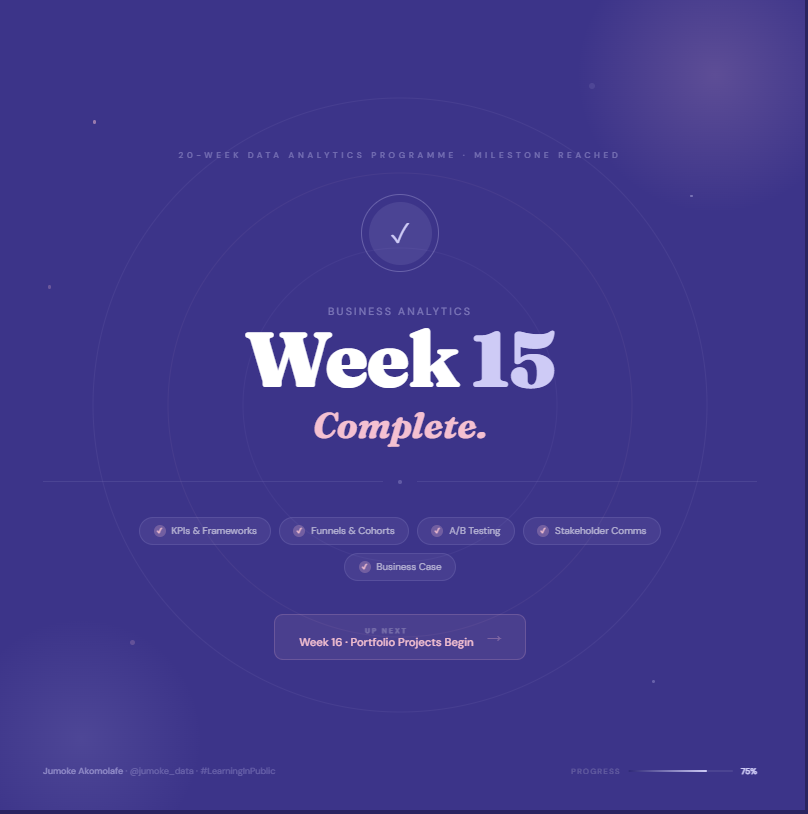
Day 5 ✅ Week 15.
Wrote my first business case today😳
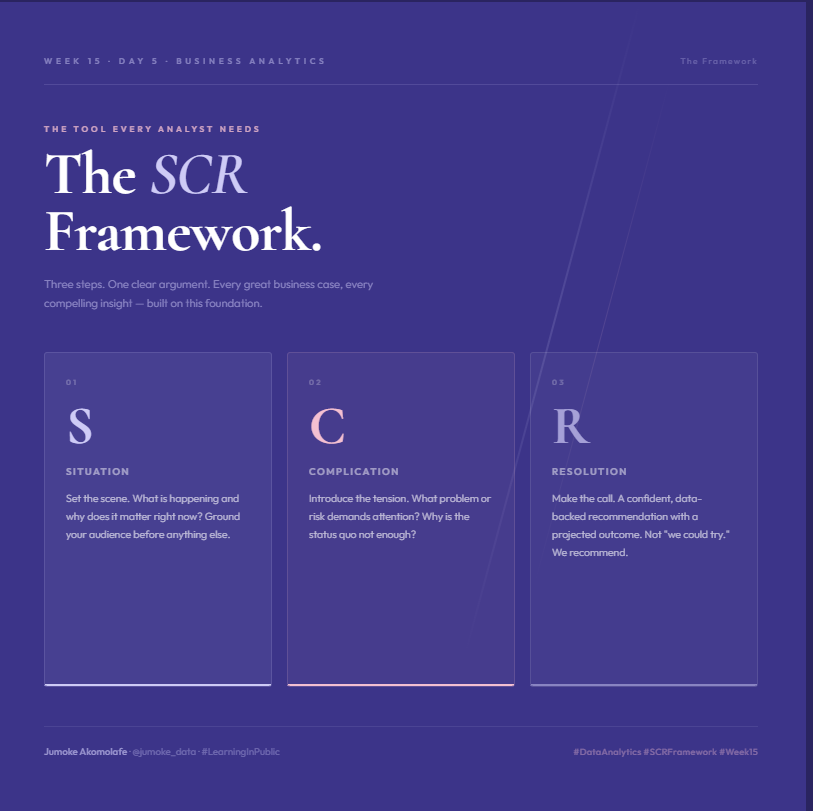
Secret? A business case is just SCR with numbers.
Situation + Complication + Resolution = a recommendation any decision-maker can act on.
Portfolio Week starts TODAY💃🔥
#DataAnalytics#LearningInPublic#CareerTransition
Day 4, Week 15 ✅
Biggest lesson today:
Your chart title should state the insight — not describe the chart.
❌ "Monthly Sales 2024"
✅ "Sales Have Declined Every Month Since January"
One shift. Completely different impact.
#DataAnalytics#LearningInPublic#jumoke_data
Day 3 of Week 15 and A/B Testing just taught me something I did not expect:
A better result is not automatically a better decision.
You still need to ask; Is the result real? Is the sample big enough?
Does the difference actually matter?
#jumoke_data#abtesting#dataanalytics
Rate tells you the problem.
Volume tells you the cost.
The most important thing I learned today as a data analyst in training.
#jumoke_data#LearningInPublic
Week 15, Day 2: Funnels & Cohorts🔥
Sales funnels show you WHERE customers drop off.
Cohort analysis shows you WHETHER you're getting better at keeping them.
two very different questions. two very different tools, both essential.
#jumoke_data#DataAnalytics
My biggest takeaway — a good analyst does not just report numbers.
They also flag what the data CANNOT tell you.
That is the part that impresses stakeholders.
My biggest takeaway — a good analyst does not just report numbers. They also flag what the data CANNOT tell you.
That is the part that impresses stakeholders.
Three frameworks to help you pick the right KPIs: SMART Goals — make your target clear before picking a metric.
Balanced Scorecard — track finance, customers, processes AND growth .
North Star Metric — one number that captures your core business value.