We don’t have Vanda’s retail series but we can use SMH as the proxy to see how it performs over the next year after seeing drawdown of 2 sd:
After 9 cold spells (dense 2017–22), SMH is up 7 of 9 times over the next year.
The median is up +13%.
Not the longest time series but it's interesting to see.
Observational.
Not financial advice.
@StockSavvyShay@FuturumEquities@StockMarketNerd Since you stacked these across the Deep Dive, figured it would be fun to see their performance YTD versus 3-year.
NBIS has just been killing it on both time frames. Too bad I miss this one.
Pulled the last three defended touches of that resistance: Nov 1980, Jul 2000, and Nov 2021.
What was the performance of growth and value in the next 12 months?
Nov 1980: Growth -6.6% / Value +16.4%.
Jul 2000: Growth -35.2% / Value +2.4%.
Nov 2021: Growth -21.8% / Value +5.3%.
Looks like value outperformed 3 out of 3 times this happened in this 1-year time frame, although its a small sample size.
*1980 = Ken French large G/V proxy
2000/2021 = IVW/IVE
Not investment advice.
@Barchart Rising 10Y doesnt automatically crush stocks. Looked at 16 trough-to-peak rises of about 100bp or more since 1962, S&P finished higher in 13 of 16.
The soft ones mostly started with yields already at 4%+. High-start: 5 of 8 up, average about +6%. Low-start: 8 of 8 up.
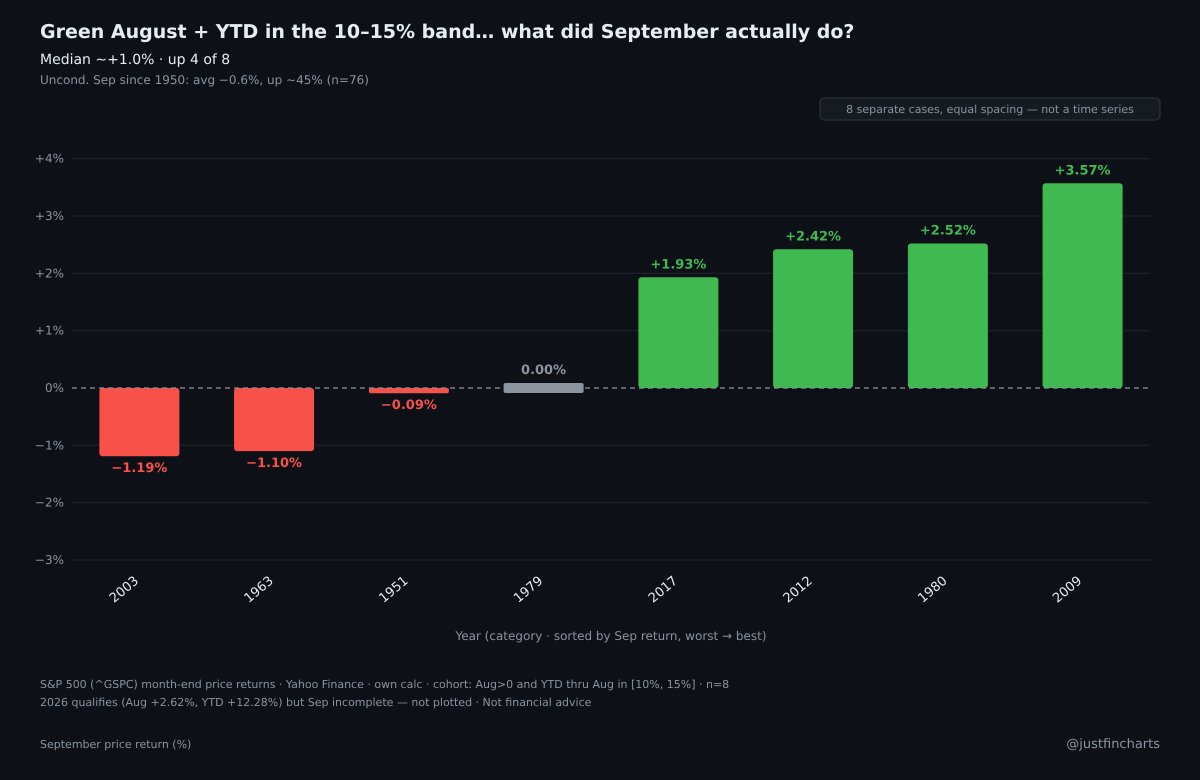
You know that September is historically the worst month.
On the S&P since 1950 it averages about -0.6% and finishes higher only ~45% of the time.
Let's narrow down the results if we do:
- Green August month +2.6%
- YTD gains of between 10-15% (12% so far this yr)
There's been 8 times since 1950 this has happened.
In those years September was basically a coin flip. Up 4 of 8, median about +1%.
Not the dump month story. Not a slam dunk either.
What actually stood out was the rest of the year. Sep through Dec was higher in 7 of those 8, average about +5.5%.
Not financial advice.
Heatmap of the sectors in the past week, 1, 3, 6 month, and YTD performance.
Some notes:
- Energy killing it this year on most all times frames
- Financials slow to start but gradually breaking out
- Healthcare has been a great place to hide
- Tech has done well as a whole but software and semis are taking turns outperforming
- Materials is a sneaky outperform
@realroseceline Good post. Conviction is so tough. Management team competence and consistent company outperformance helps with convincing myself on that
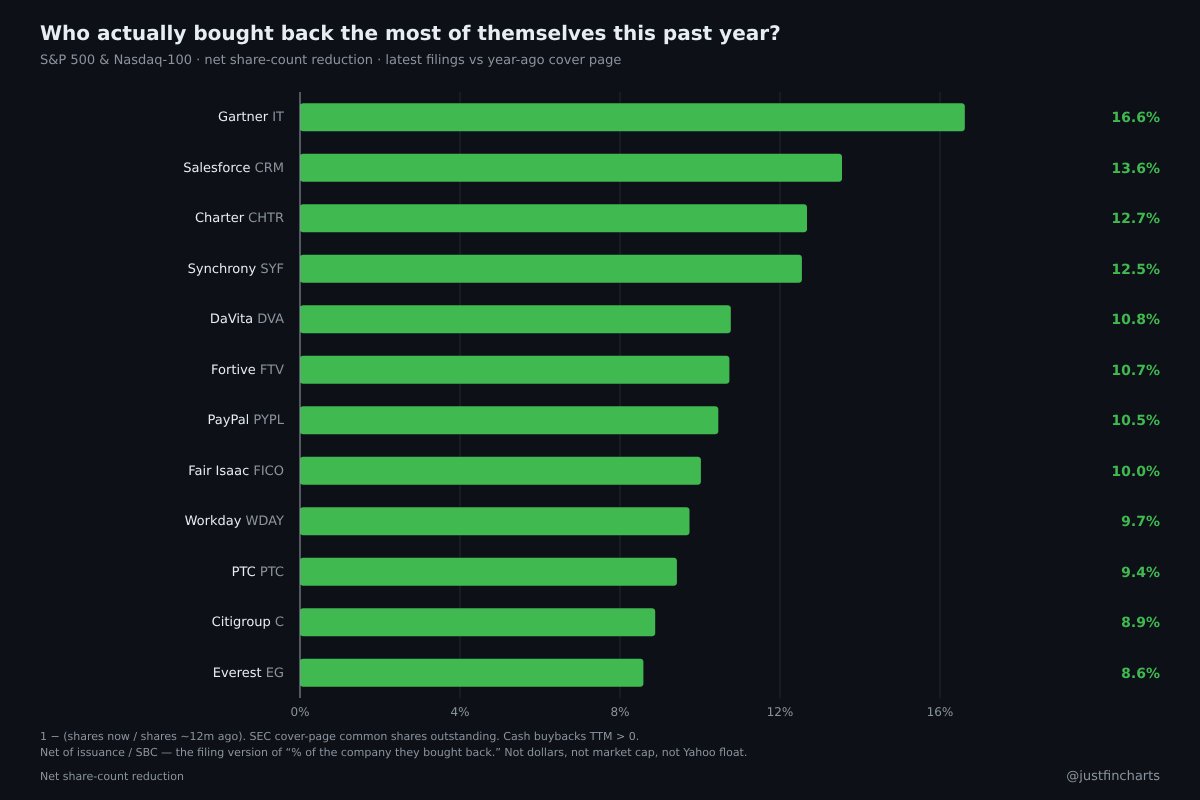
Who actually bought back the most of themselves this past year?
Looked at who actually retired the most of their own share count (S&P 500 and Nasdaq-100).
% of shares repurchased:
Gartner retired 16.6% of itself
Salesforce 13.6%
Charter 12.7%
Synchrony 12.5%
PayPal 10.5%
Apple spent the most dollars and only shrank 1.7%. Nvidia 0.8%.
Who actually bought back the most of themselves this past year?
Looked at who actually retired the most of their own share count in both the S&P 500 and Nasdaq-100 in percentage terms of their total float in the past year.
Gartner retired 16.6% of itself
Salesforce 13.6%
Charter 12.7%
Synchrony 12.5%
PayPal 10.5%
By absolute dollar amount, Apple spent the most dollars and only shrank 1.7%. Nvidia 0.8%.
Did the fintech kids actually take share from the banks this year?
This year fintech did not take share as a group.
Banks +9.3%
Fintech -4.7%
Block is the one that ran, +28%.
Citi and BofA beat the index. SoFi is -31%
Over three years it flips.
Robinhood +888%
Affirm +333%
Fintech sleeve +247% vs banks +167% vs the S&P +80%
This year its the banks. The three year tape is Robinhood and Affirm.
How are travel names doing?
Looked at hotels, airlines, cruises, booking apps this year and the 3-year period.
This year $ABNB is the one that ran +36%.
$DAL and $MAR just ahead of the S&P.
$BKNG is actually red.
Equal weight the group is +9% vs the S&P +14%.
Over three years:
$EXPE +199%
$RCL +198%
$UAL +128%
$AAL is still red on both.
So this year its Airbnb. The three year tape is Expedia and the cruise ship. Planes are mixed.
Not financial advice.