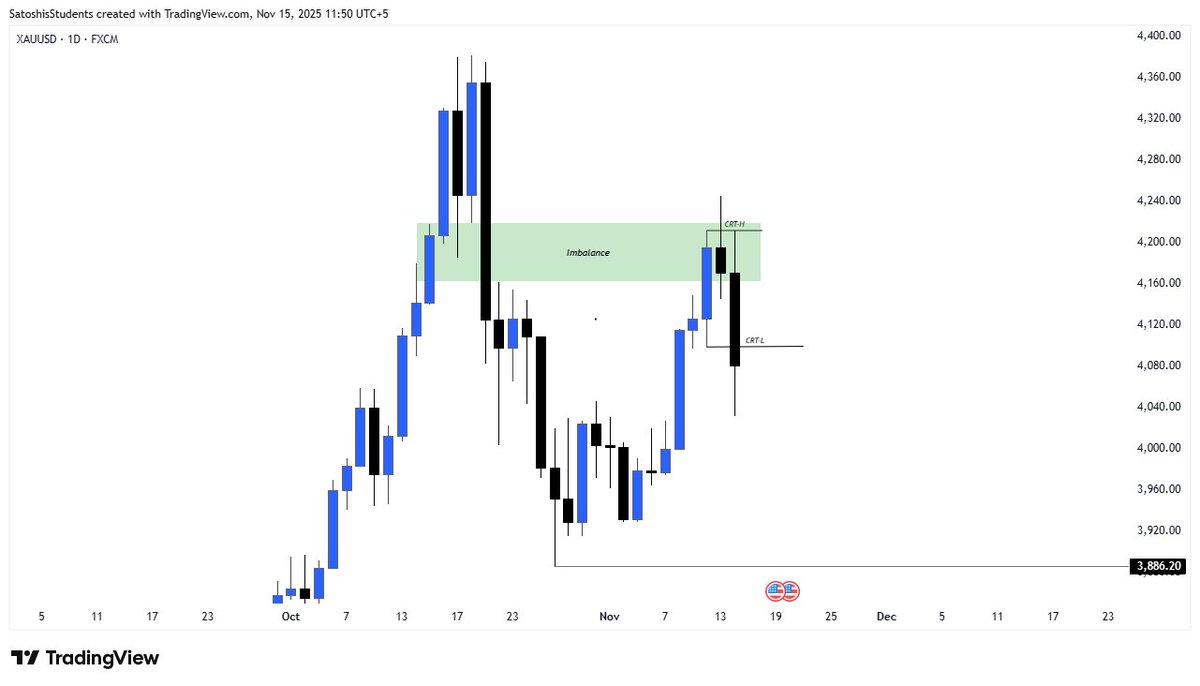
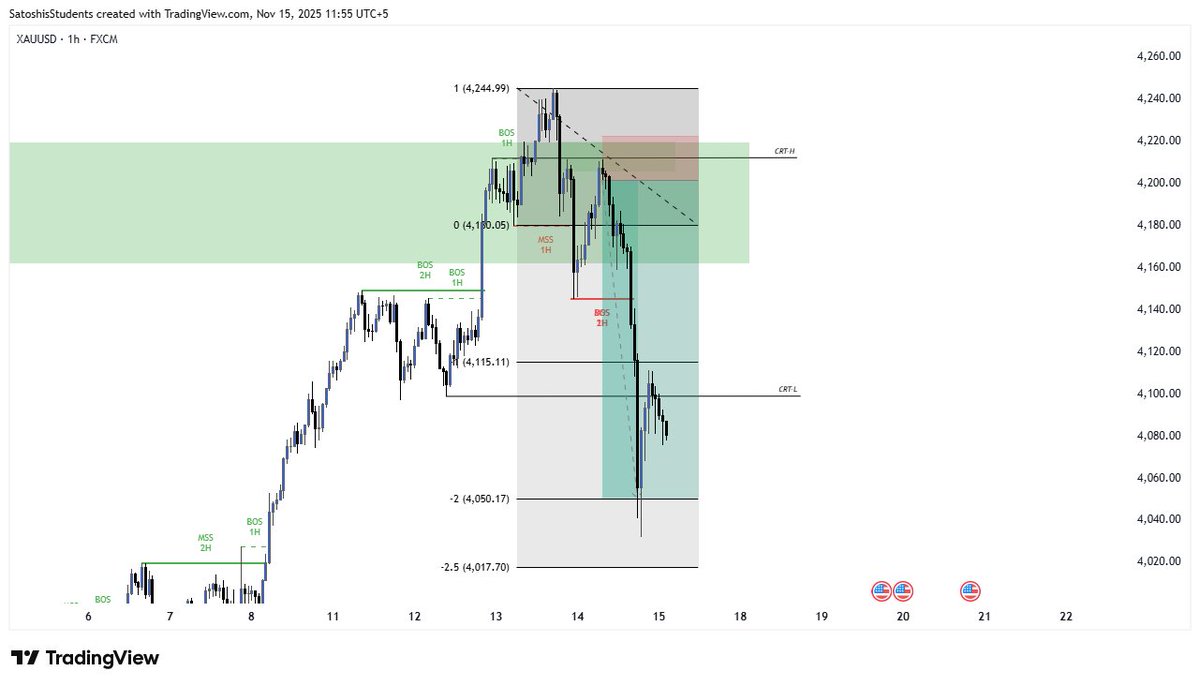
1: #backtesting of #CRT
Sometimes we focus only one side, but we don’t take the time to analyze what the market actually wants to do. A multi-timeframe analysis is the best approach to identify market probabilities.
Study : Price often leaves its footprint before the move.
XAUUSD: 4H RSI divergence + SMT → HTF OB → repeated rejection → 1H displacement → 30M swing break → distribution.
Price is algorithmic. The same behavior can repeat before the move.
Not magic. Read the footprint.
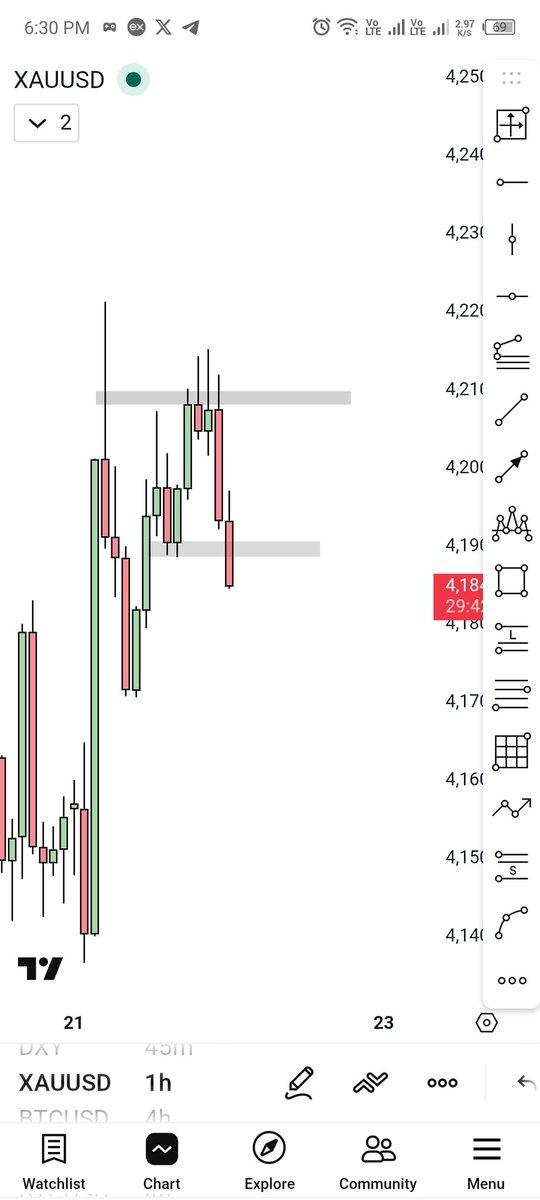
@tradesbysci Hi. @tradesbysci can you please giude entry for low capital. I have full understand Icc. But on entry time Sl on capital seems very big even I enter with 0.01 lot too .
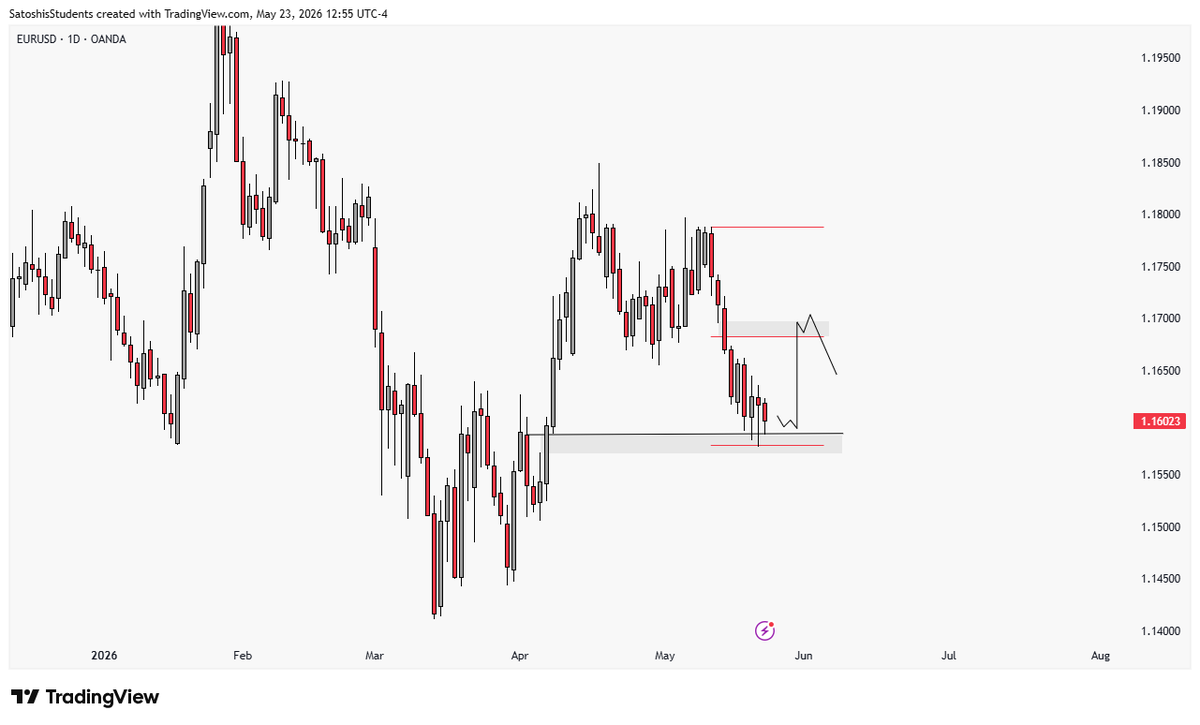
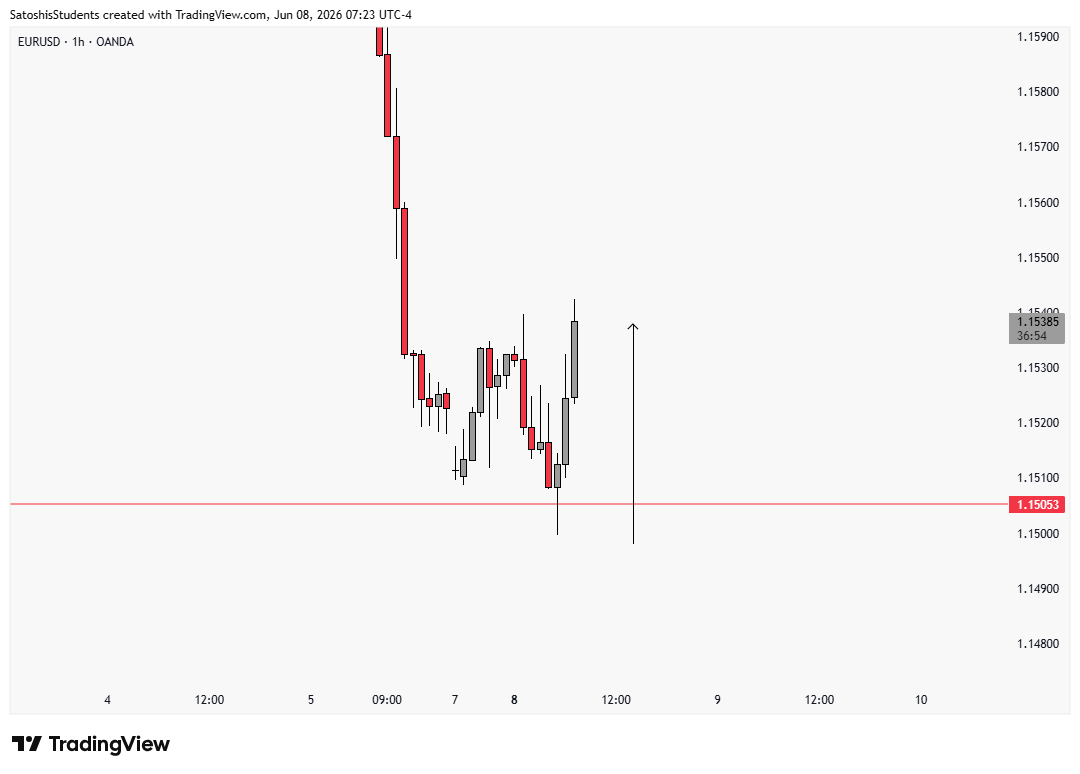
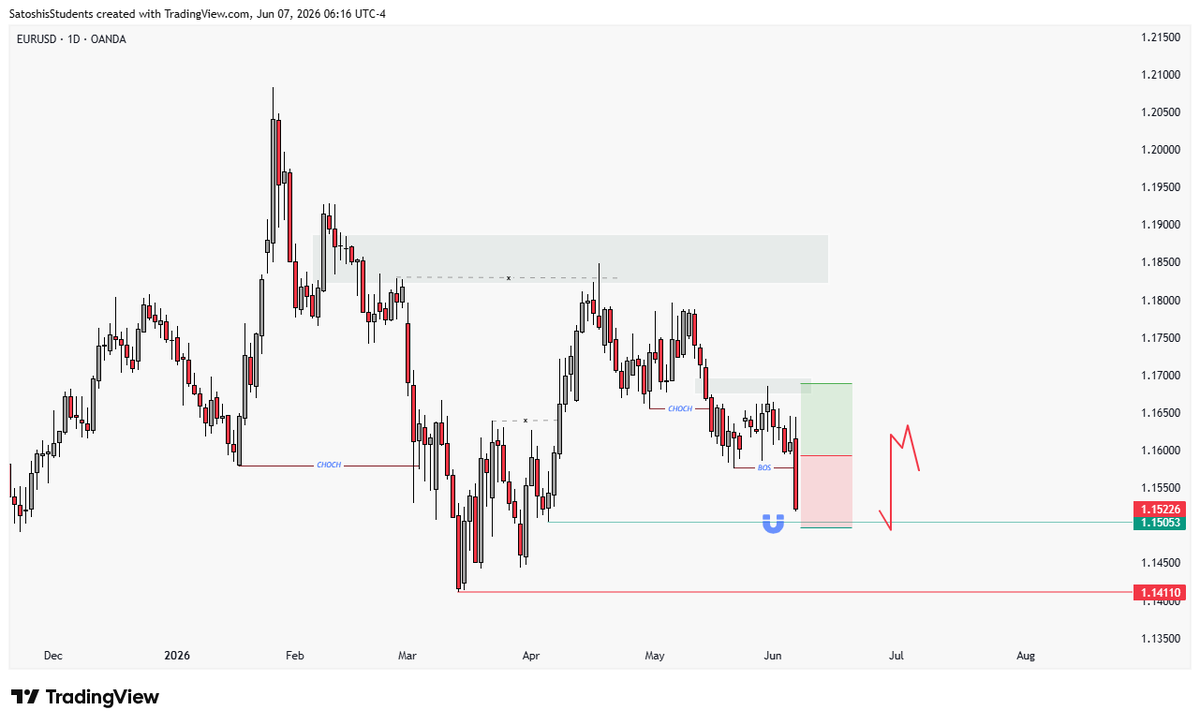
$EURUSD reached the projected discount zone exactly as outlined in the previous analysis. Price is now reacting from this key area, and the next move could define short-term direction.
Are you expecting a bullish continuation from here, or another rejection lower?
#EURUSD
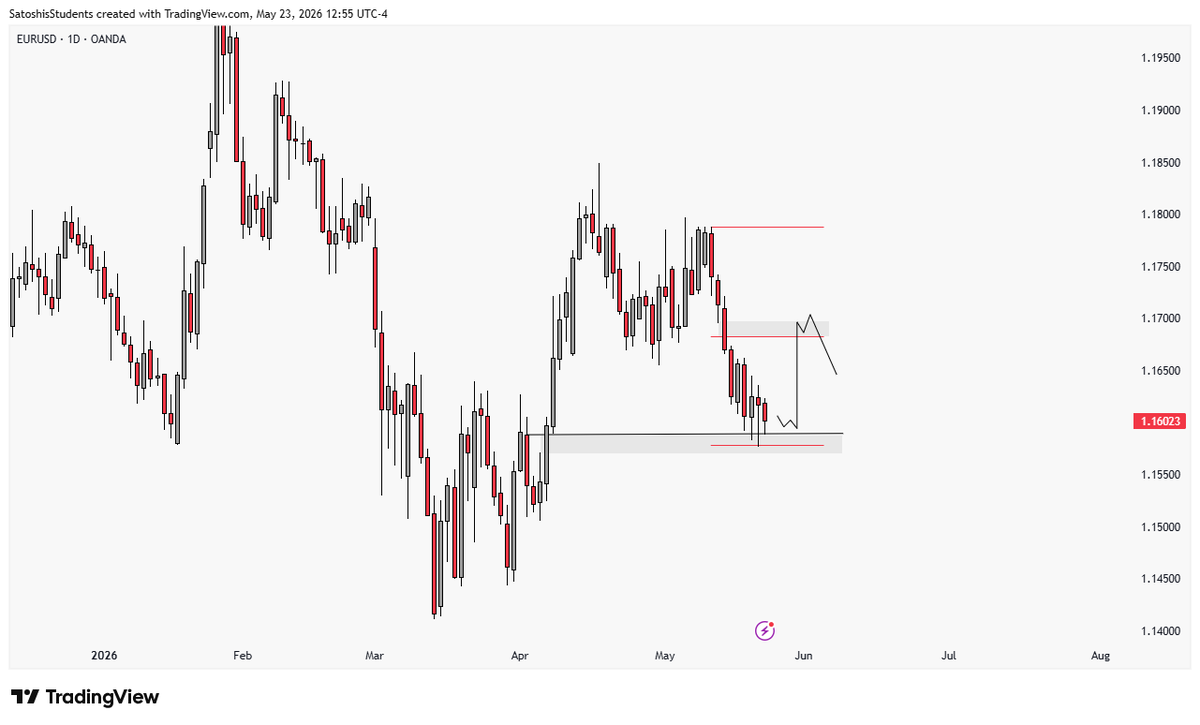
EURUSD is showing continued weakness after rejecting the lower high resistance zone.
If price continues to reject below this level, we could see a retracement toward the equilibrium area before the next major move.
#eurusd
EURUSD is showing continued weakness after rejecting the lower high resistance zone.
If price continues to reject below this level, we could see a retracement toward the equilibrium area before the next major move.
#eurusd