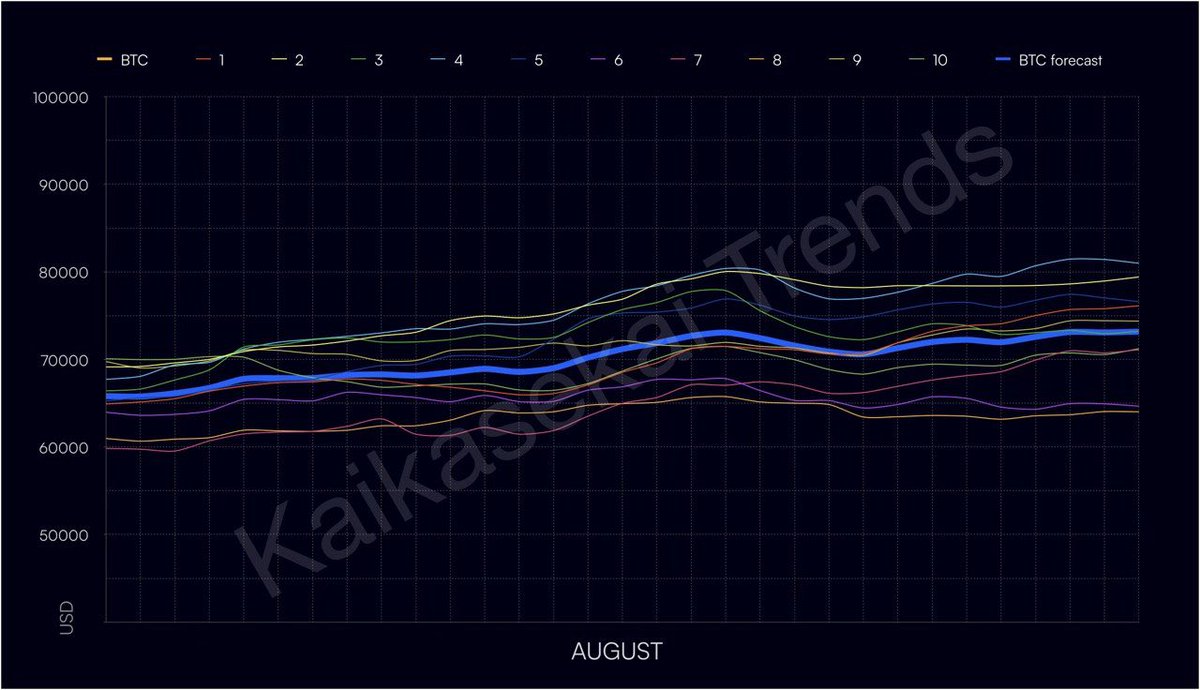
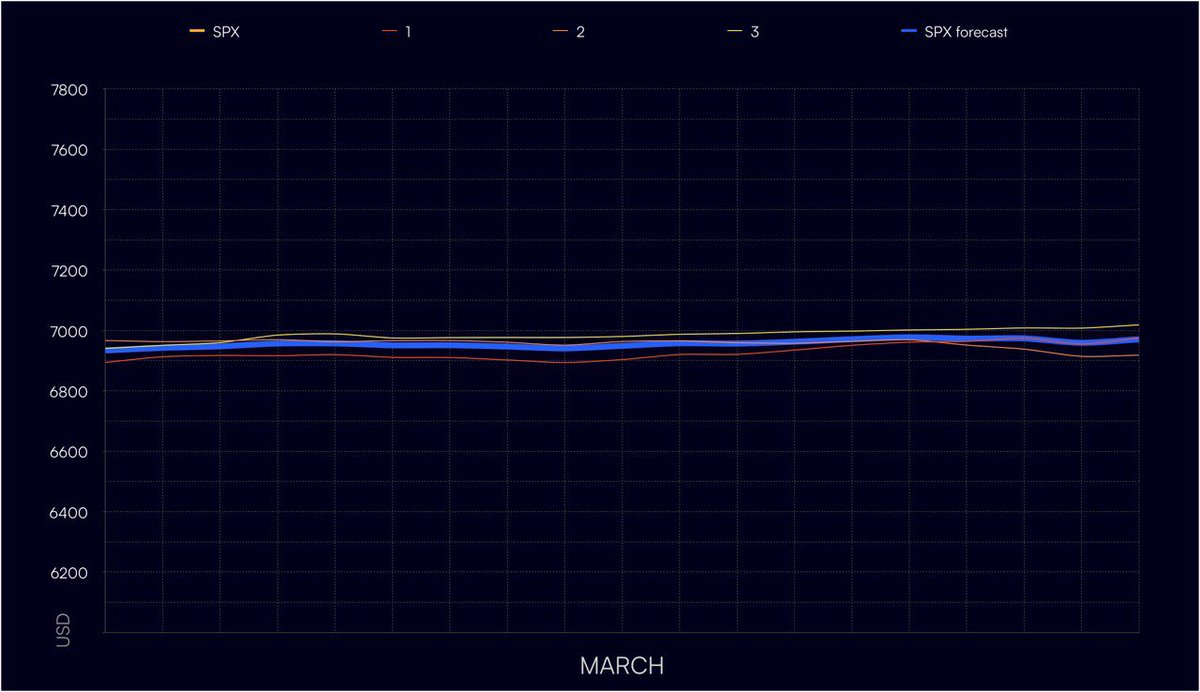
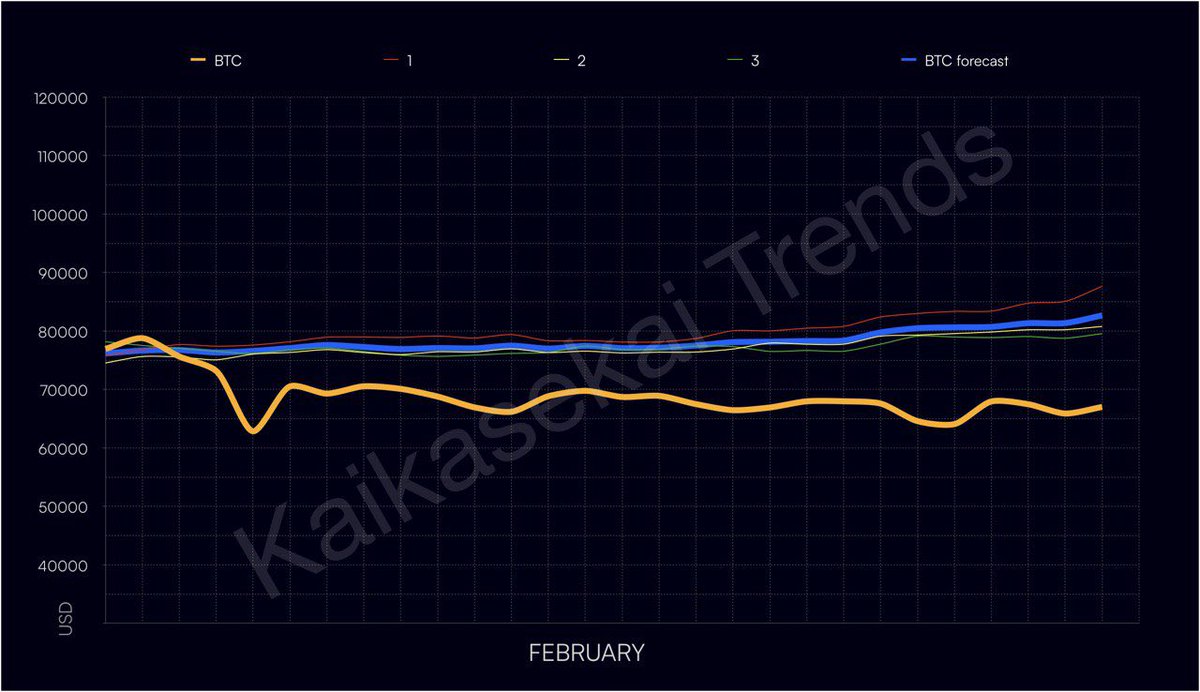
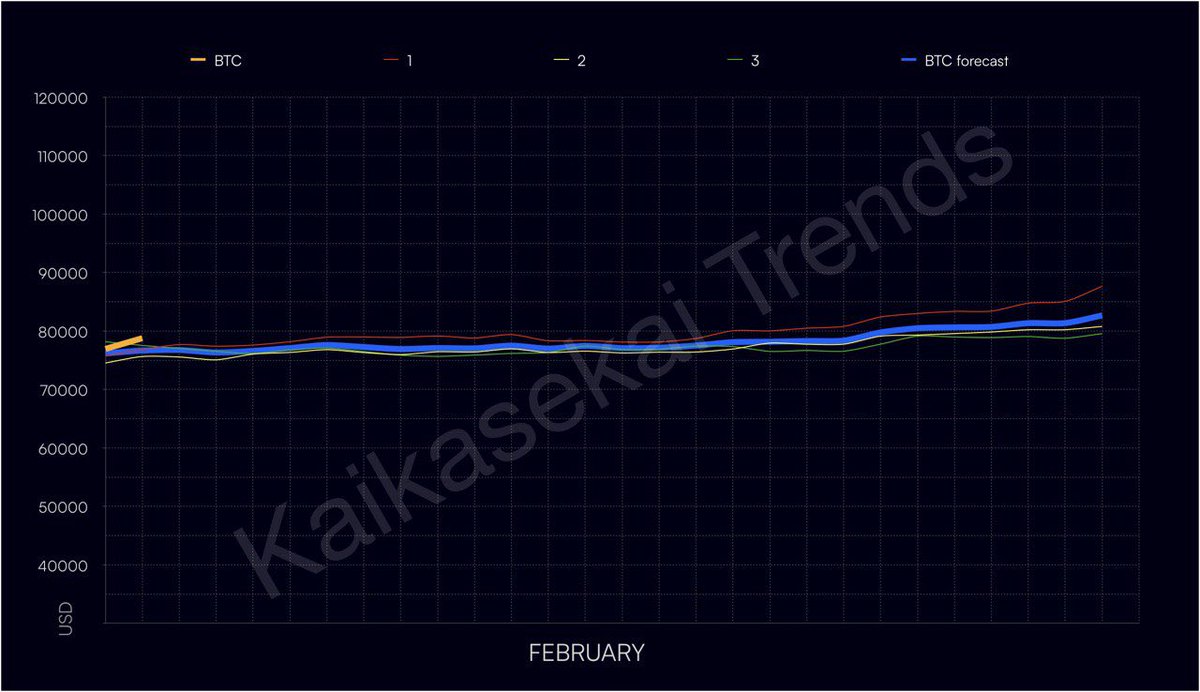
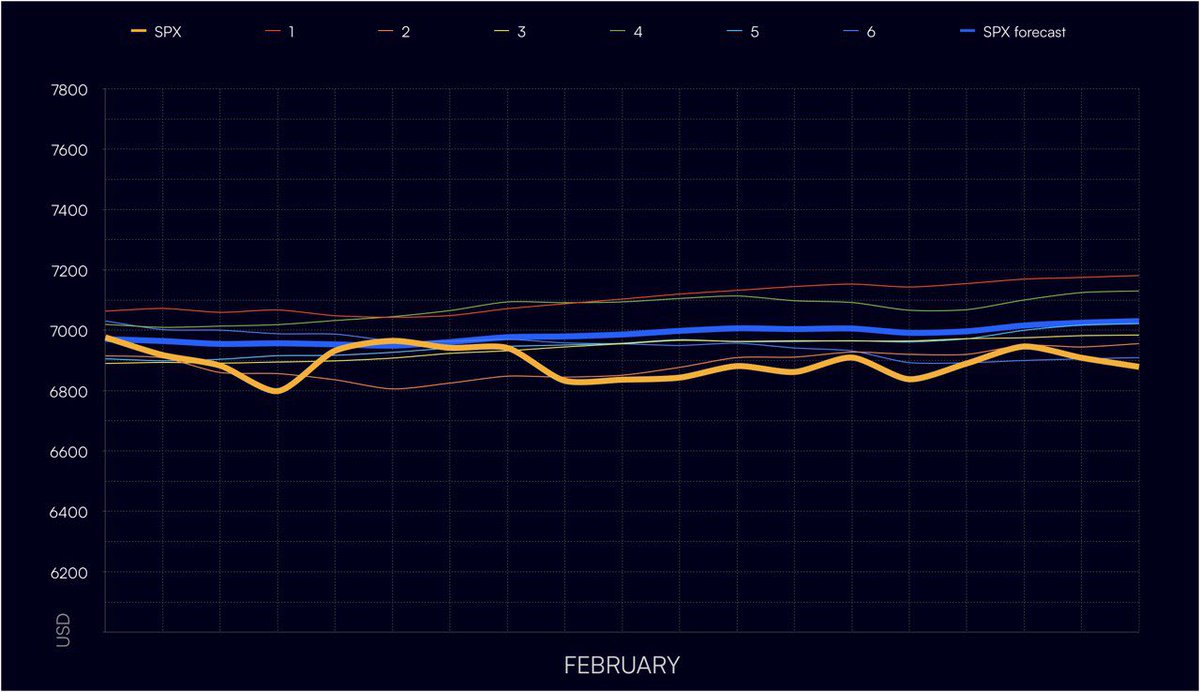
$BTC Forecast for August: The blue line is the main forecast, representing the average of the most likely Bitcoin price scenarios. The thin colored lines show the individual scenarios.
BTC Forecast for July:
Global trend is bullish, local structure is sideways. Thin lines represent the range of the most likely BTC scenarios. Orange represents BTC history. Blue represents the average forecast.
$BTC #Bitcoin
BTC Forecast for July:
Global trend is bullish, local structure is sideways. Thin lines represent the range of the most likely BTC scenarios. Orange represents BTC history. Blue represents the average forecast.
$BTC #Bitcoin
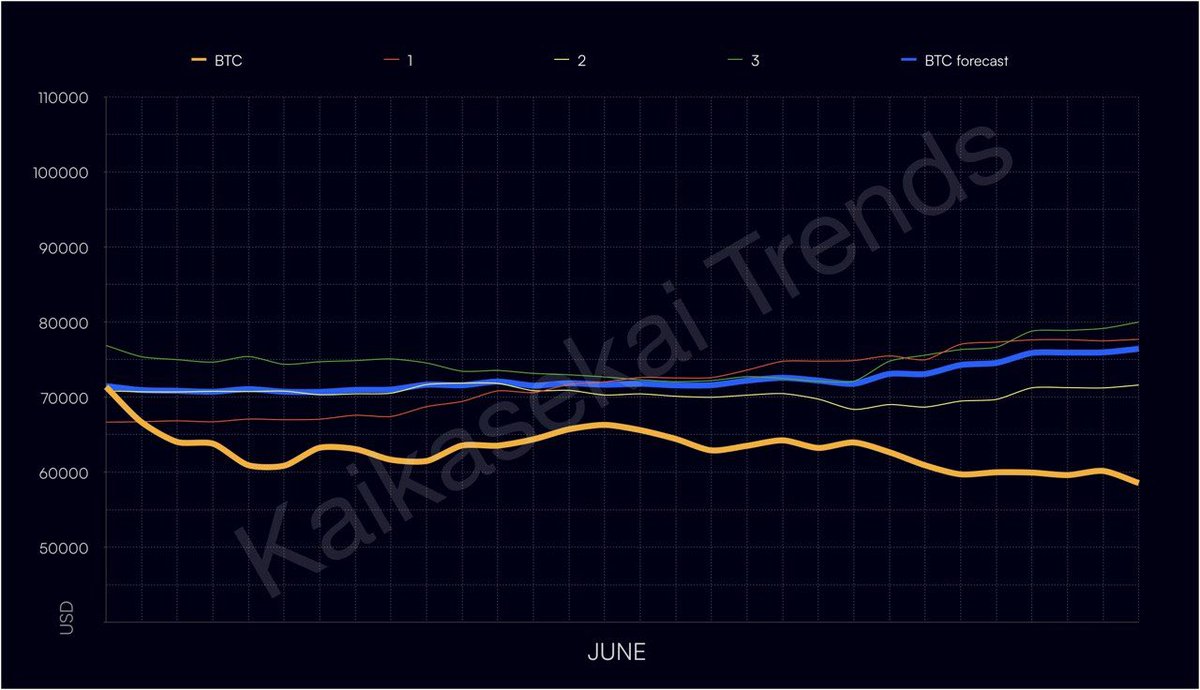
June bitcoin:native forecast
The thin lines indicate the range of the most likely BTC scenarios, the orange line shows the actual price movement, and the blue line shows the forecast.
The July forecast and all timestamps are available on the website.
June bitcoin:native forecast
The thin lines indicate the range of the most likely BTC scenarios, the orange line shows the actual price movement, and the blue line shows the forecast.
The July forecast and all timestamps are available on the website.
The forecast accuracy for May is 94.17% (based on the $BTC price)
thin lines represent the range of most likely BTC scenarios, orange represents BTC history, and blue represents the averaged forecast
May #Predict for $btc
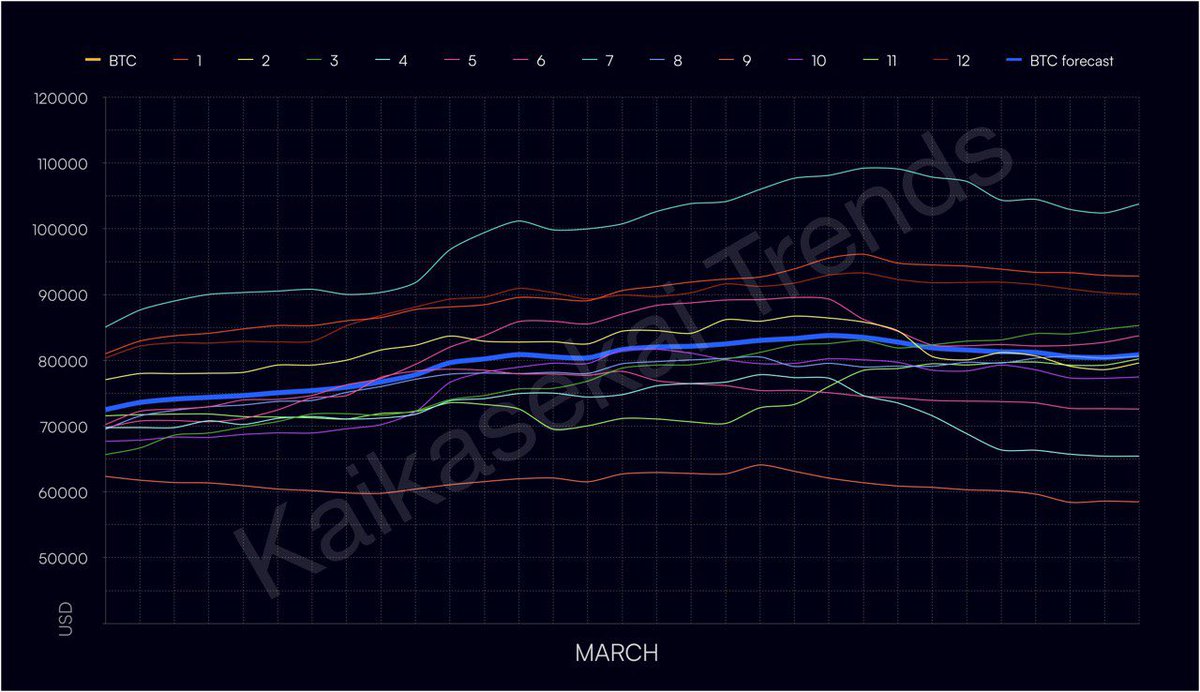
The bold blue line represents the consensus of AI models scenarios (thin lines), capturing the macro BTC trend while filtering out short-term price noise.
May #Predict for $btc
The bold blue line represents the consensus of AI models scenarios (thin lines), capturing the macro BTC trend while filtering out short-term price noise.
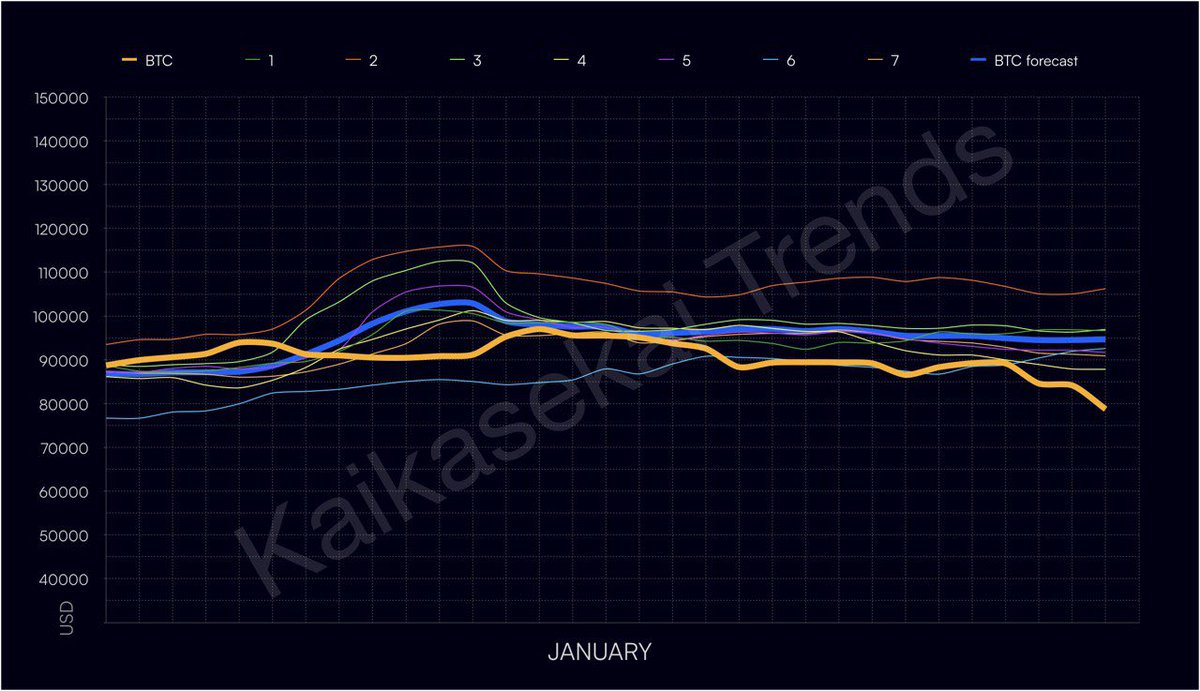
January #Bitcoin forecast
The bold blue line represents the consensus of AI model scenarios (thin lines), capturing the macro $BTC trend while filtering out short-term price noise.