https://t.co/zqeIa2fqJj
It's here. And it's free (for now).
14 pages of content on Elliot Wave Theory.
This will help you understand the:
-Rules.
-Patterns.
-Fibonacci levels.
-And more...
EW Theory can help predict price movements and current structure.
Identify corrective waves patterns which can allow you to anticipate price action.
I made this to improve my skills and edge. I believe having more knowledge can lead to more potential profits.
Enjoy the read. Likes and reposts much appreciated fam.
#btc trading below the quarterly open.
Price has only managed to sweep the previous quarter low and is now above it.
The key will be at the close Vs the level on pic 2 - 62.7k
Close above and the next quarter has high probabilities of being bullish.
Close below it and the next quarter has high probabilities of being bearish.
#crypto
#btc at make or break level.
Bulls have gained the weekly open but the previous week's swing resistance hasn't been broken.
The bears remain in control unless we flip that level into support.
#crypto
Good post indeed.
A simple and effective analysis on quarterly structure and a very valid target and reasons for the low.
I find this type of analysis based on pure price action (which is what I use) way more useful than all these charts I see posted calling bottoms out of a single thing like an indicator, a fractal, a fib...
The only thing that matters is structure. Yes, other things can be useful for narrative and confluence.
@CryptoJelleNL Not an impossible idea at all.
There are other technical reasons which I think also make this a possibility.
But until we break the previous multi month range from 2024, which can take a while (we can still be in this range for the next quarter), who knows.
@lourenco_vs 😂 this is why TA is often compared to horoscope/astrology for males...
A couple of things (chart patterns + an Elliot ABC) and the guy is convinced he's saying something meaningful.
That or he just knows he's bullshitting the audience.
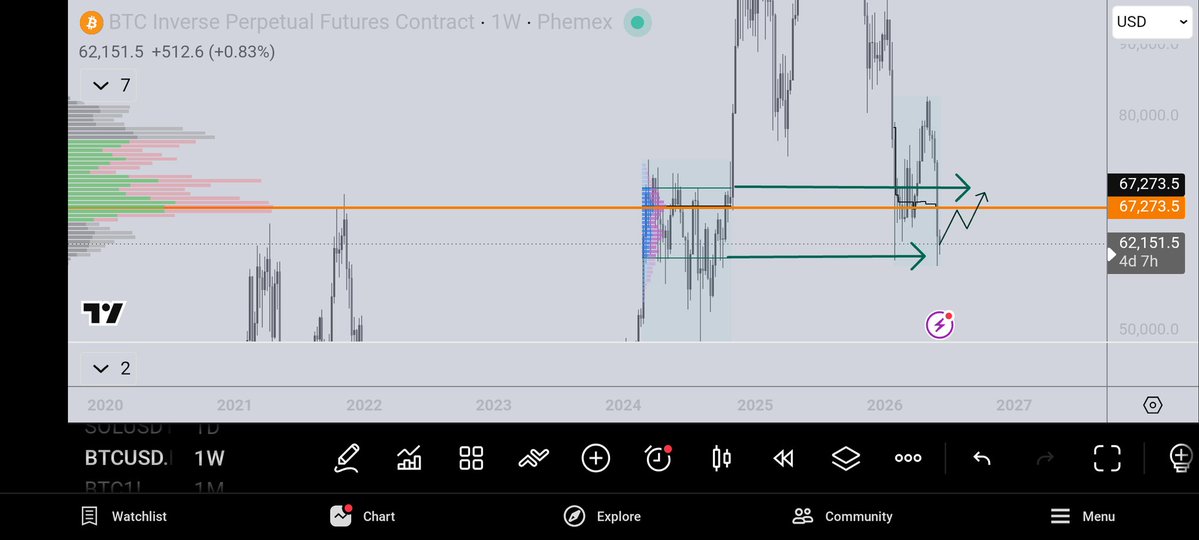
#btc price at the line in the sand.
Price is attempting to stay above the POC for two multi month ranges, one in 2025 and the current range of 2026.
Consider this level key locally and decisive for the next leg move
#crypto#trading
Decent move 20% approx in one of the #altcoins charts I left in a watchlist this last weekend.
Let's see where $autonomi is able to close the week. It will give a better idea of the potential upside of the chart.
#crypto
@marketbuyonly Curious on what is usually your chart target on that half hour?
A test of a previous swing on a given timeframe trend? Or a swing on a higher timeframe?
About the low being in or not...
I posted this observation about the existing structure not resembling a swing low. It seems it had a point.
Here is what I was expecting to see for a low. Not saying it's in but the PA structure forming looks more like a possible swing low.
#crypto #btc
Look at the higher lows on the weekly...
It doesn't add up to me.
The structure of price action for a swing low isn't there yet.
I think this is the first drive for the higher low to form but we will see a sweep of the current low.
#btc#crypto
The chart which often serves as one of the best confluence for #btc price:
$usdt.d
Has reversed the downtrend and made a quick move up being now at key resistance.
What could this mean for BTC...
It has found support.
Usdt.d dominance is likely to reject resistance and continue lower to the support level mentioned (green box below).
This would mean BTC would move higher from here.
#crypto
$usdt.d rejected at the level as anticipated (post below).
#btc found upward momentum.
But USD.t dominance has a relevant support POI.
The levels on the USDt dominance chart correlated as expected with the Ponzi chart so don't take this POI lightly.
Follow to stay up to date.
$btc dominance at support level⚠️
As explained in the post below, this has been a multi month support level.
Is this level where #btc price can find support too and move higher...
#crypto
$btc dominance rejected the mayor level which has marked several cycle tops when reached.
But the rejection has held support since August 2025.
Holding support during a monthly uptrend like that one can only signal strength.
This means to me there are still probabilities of uptrend continuation to test the box territory again.
#crypto #trading
@telagathoti Interesting, not far from the level I have marked for the #btc correlation, between 94-95 on the $dxy chart.
Anyway, these correlations seem to offer reliable levels and are worth keeping an eye on.
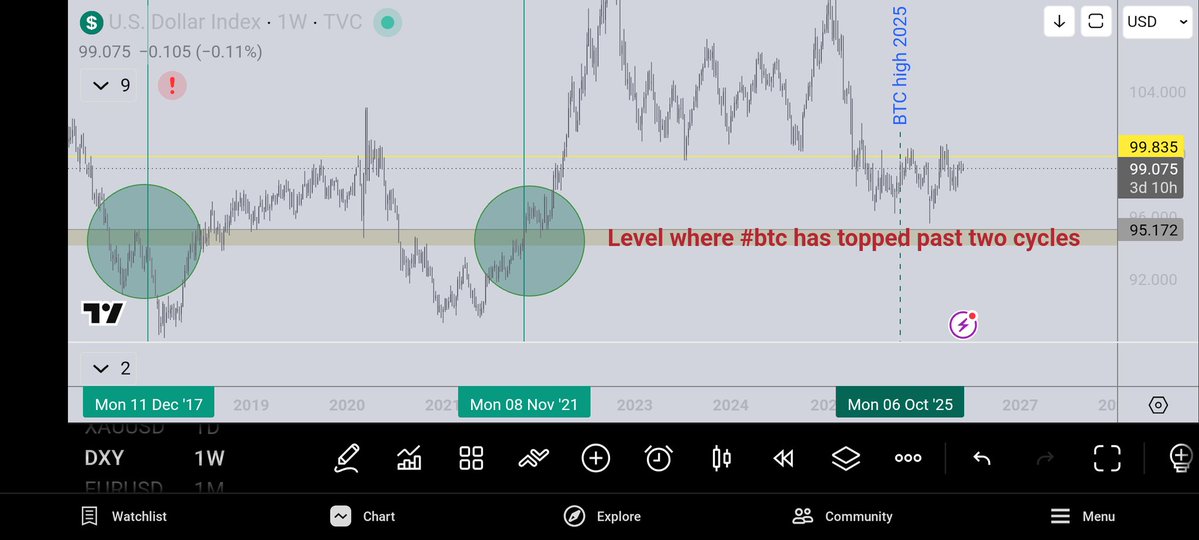
$btc high last year was just above the key support-resistance level on $dxy where the dollar flip s-r at the past #btc cycle tops.
I posted the chart comparison last summer to watch for this correlation.
Another chart comparison comparing #BTC cycle top.
This one with DXY.
Both cycle tops (2017 and 2021) DXY was flipping the rectangle area.
DXY is currently on a downtrend and heading towards the rectangle area.
Could that level be related to a cycle top once again?
As posted below, after breaking the first level $btc was going to test the level below.
These are levels fairly strong and how price resolves them is key for the next move.
This time #btc has swept it already and is trading above it.
Price is very likely to test higher now and this could even be the low of the month.
#crypto
The level shared which had chances of holding support was broken and the bulls couldn't reclaim it for the close yesterday.
The level below it with the same strength sits at 62794 K.
I think price continues lower at least to tap the level or even sweep it.
#btc#crypto
@XBTkaz I was expecting lower too but the green monthly candle printed in the Heikin Ashi chart got me by surprise and I consider upside price action from this level, at least for a retest.
But until we have at least a weekly bullish signal this means nothing, of course.
Daily price action update...
I'm looking for an entry after staying on the sidelines the last couple of days.
Here we have what could be a signal.
Heikin Ashi chart = less noise.
#btc#crypto