🚨 $SPCX IS IN ITS FINAL ACCUMULATION PHASE
And the chart is copying $TSLA so precisely it should be illegal
2016: Tesla buys SolarCity. Wall Street screams "bailout." Retail dumps in disgust
What followed: +20,490% from the merge zone to 10-year ATH
Holders who survived boredom got paid for a decade
Now put two monthly charts side by side
Tesla x SolarCity merge: circled at bottom of a multi-year base, right before vertical move
Tesla x SpaceX merge: forming RIGHT NOW, with $SPCX sitting at ~$110 - exact same structural spot on exact same pattern
Same math projected forward: +22,120%
And this time the calendar is already written:
- February: SpaceX absorbs xAI. Combined entity: $1.25 TRILLION
- March: FTC clears Tesla to convert its $2B xAI stake into direct SpaceX equity
- June: Wedbush puts 80-90% odds on a full Tesla x SpaceX merger by early 2027
This isn't a forecast. It's a countdown
Accumulation is the phase where the chart looks dead and headlines do the shaking
SolarCity holders ate years of "bailout" articles before payoff. $SPCX holders are eating "unlock dump" articles right now
Same script. Same author. 10x the scale
My zone stays $85-$100 - pre-merger prices on the biggest structural move of the decade
Once this breaks out, these levels never print again
Tesla never came back to its merge price. Neither will SpaceX
You're either early or you're the exit
Turn on notifs - I'll post it here moment the signal confirms
🚨 ALERT:
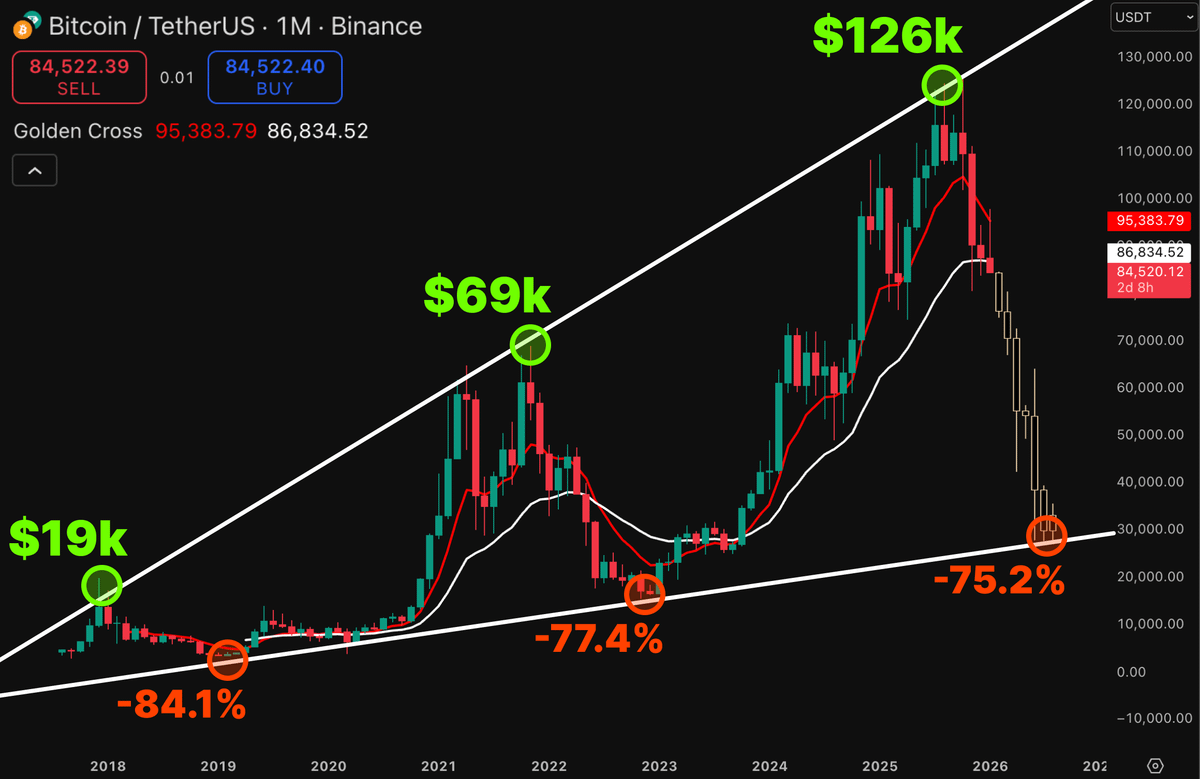
$BTC is preparing for a massive dump to ~$32k
Every cycle, history repeats itself:
- 2017: $19k PEAK → 2018: -84.1%
- 2021: $69k PEAK → 2022: -77.4%
- 2025: $126k PEAK → 2026: -72.2%
Things are about to get worse – Bookmark it...
🚨 $ETH IS FORMING WYCKOFF ACCUMULATION
What points to this?
Right now, market is completing “resistance zone test” phase after pushing above $2,360
Based on historical data, this is usually followed by a price pullback - but it’s not that simple...
Here’s my 3-6 month roadmap:
1. Decline → test $1,750–$1,500 support
2. Breakdown → “Spring” around $1,300
3. Recovery → support retest
4. Strong rally → “SOS” & “BU”
5. Break resistance → rally toward $4,000
In short: I expect a drop toward ~$1,300 first, followed by a recovery toward $4,000.
Full structure will take time to develop, but by end of year we could already be at stage 4 - around $2,700
Don’t rush into buying $ETH here - turn on notifs, I’ll update
🚨 THE FINAL BITCOIN BULL TRAP IS OVER
Bitcoin has rejected $83K, and the pattern is now complete.
I warned you this was the last chance to sell before the final flush.
$81K → $72K → $67K → $58K → $53K
Then the next bull run begins.
Reminder: I publicly called Bitcoin's $17K bottom in 2022 and the $126K top in 2025.
My next call will be the biggest one of this cycle.
Turn on notifications.
Most people will follow me too late.
🚨 $SPX IS FOLLOWING THE PLAN PERFECTLY
Most traders still think this is nothing more than a normal pullback.
But inflation is starting to pick up again.
The Fed is becoming more hawkish.
And another rate hike is back on the table.
At the same time, $SPX is being held up by just a few mega-cap stocks.
Now those leaders are beginning to break down.
We’ve seen this setup before.
2018 → almost -20%
2022 → roughly -25%
If the Fed hikes again, the selloff could become much more aggressive.
My target:
$SPX ~7,800 → ~6,000
That’s around a 25% drop.
I still wouldn’t be buying this dip yet.
Watch the next move closely.
I’ll post the warning before it becomes obvious.
🚨 WARNING: THE BULL TRAP IS OFFICIALLY OVER
Bitcoin just failed to break $82K and confirmed the end of the relief rally.
Everything is playing out exactly as I predicted.
$81K → $73K → $64K → $47K
Don’t become exit liquidity.
Save this chart and compare it later.
Quick reminder:
I publicly called Bitcoin’s $17K bottom in 2022.
Then I publicly called the $126K top in 2025.
The next call will be posted here first.
Follow and turn notifications on.
🚨 SPX IS FOLLOWING A WYCKOFF SCRIPT 🚨
This pattern was developed decades ago
When I was studying markets I kept seeing it in every major textbook
And around 70% of the time it played out exactly as the textbook described
The idea is simple:
"Institutions don't sell all at once"
They unload slowly while retail keeps buying, creating the illusion of a healthy market
Look at this chart and you'll see exactly that playing out right now
Buying Climax printed at the top - smart money selling into retail euphoria
Upthrust already happened - one push above resistance that trapped late longs
Right now we're consolidating before the final move - the UTAD
That's the last push above the old highs that will feel like a breakout to most people
It isn't
After the UTAD prints, the Creek begins and the real markdown follows
Dip to $7,200, squeeze to $7,800 - one last batch of buyers gets trapped
Then the flush to $6,150 - the Spring that feels like the end of everything
After that - recovery toward $8,300 by late 2027
The crowd will panic sell the Spring and miss the entire next leg
I called the $SPCX pattern before the IPO launched - publicly, on this page
The setup played out exactly as posted and the people following closely caught the initial rally
What comes next is the most important update I'll post on this stock
Turn on notifications - you don't want to find out about it from someone else's repost
🚨 BTC IS FORMING THE BIGGEST BULL TRAP OF 2026
Just look at the chart, exact same happened in July 2022:
2022 July-August - Relief rally from $18k to $24,800, fakeout above MA200, then final flush to $16,304
2026 July-August - Same relief rally and 200W MA fakeout incoming
The MA200 isn't acting as support here - it's the retest zone before the final leg
This bounce is real, so was the one before the flush in 2022
Target: $67k, watching the price action there
Follow + notifs on, I will keep you updated