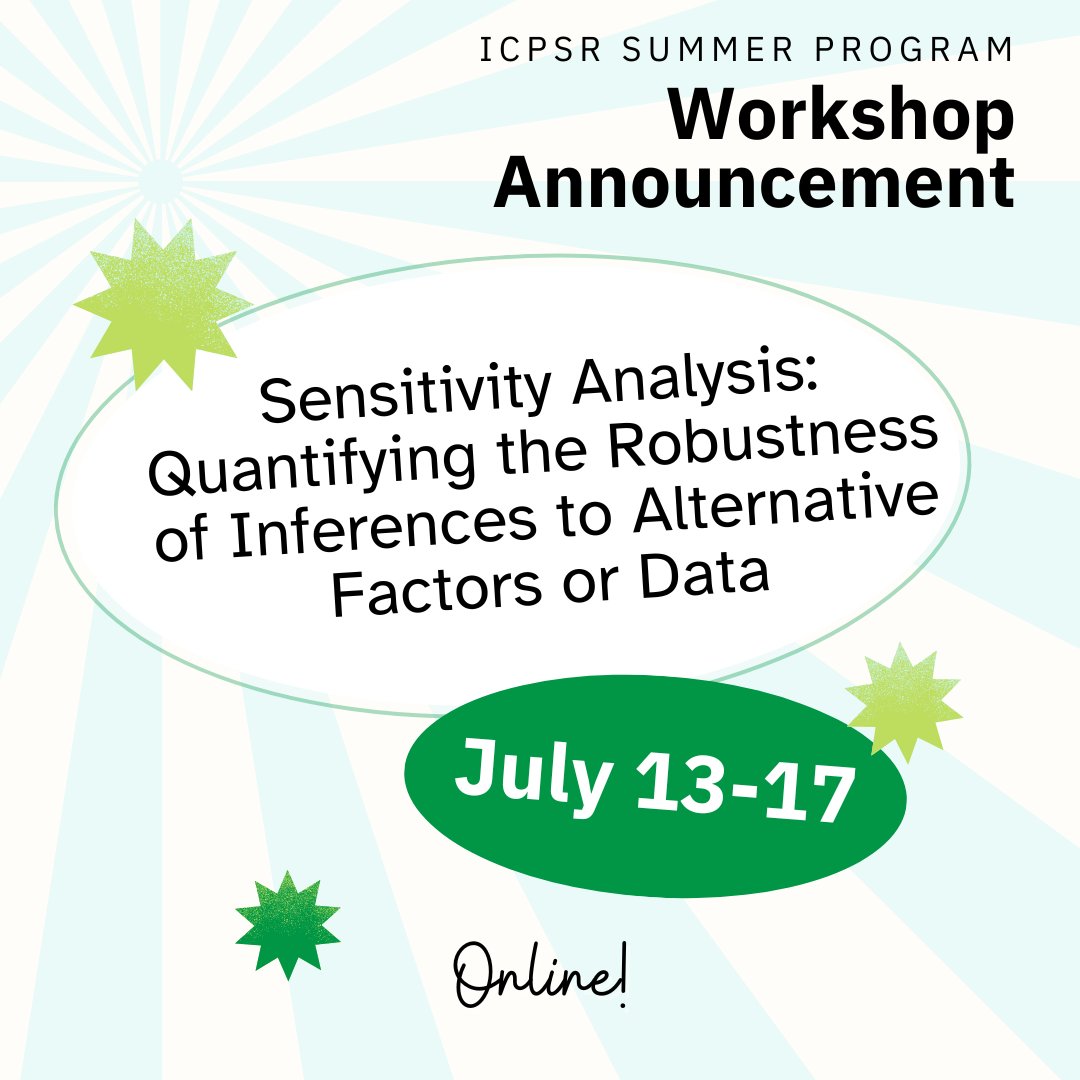
Refine your data inference skills in "Sensitivity Analysis: Quantifying the Robustness of Inferences to Alternative Factors or Data"! Change "Have you controlled for X” to “How strong would X have to be to change our mind?”
Register now! https://t.co/R3uA2zzhIK
#ICPSR#SumProg
Ready to refine your data inference skills? 🔢📝
In "Sensitivity Analysis: Quantifying the Robustness of Inferences to Alternative Factors or Data" you will quantify the strength of evidence in a study!
Register now! https://t.co/i4TSDmoOTt
#ICPSR#SumProg#SensitivityAnalysis
I am excited to give a workshop July 28-Aug 1 with ICPSR. Hope to see you there!
Sensitivity Analysis: Quantifying the Robustness of Inferences to Alternative Factors or Data: https://t.co/BqQbI5smje
I am excited to give a workshop July 28-Aug 1 with ICPSR. Hope to see you there!
Sensitivity Analysis: Quantifying the Robustness of Inferences to Alternative Factors or Data: https://t.co/BqQbI5smje
check out the 1st hour of my "Sensitivity Analysis for Causal Inference" seminar on YouTube: https://t.co/rm35WIpNZV . Join the full seminar Mar. 5-6 to dive deeper into techniques to quantify the robustness of inferences. https://t.co/JpxRnj19tt
Curious about #sensitivityanalysis in #causalinference? Watch the 1st hour of @kenfrank20’s "Sensitivity Analysis for Causal Inference" seminar on YouTube. Join the full seminar Mar. 5-6 to dive deeper into robust inference techniques. https://t.co/oOYpFcI2aU
Happy holidays! We have released new versions of the konfound package for statistical sensitivity analysis in R (1.0.2) and in Stata. Full announcement including new features and capabilities is here: https://t.co/YYrPzC7gWS .
@NateSilver538 Or, to change the inference, one would have to replace about a third of the states (13) with states for which there was no effect of inflation on voting preference.
For details, including R and Stata code, go here.
@NateSilver538 Or, to change the inference, one would have to replace about a third of the states (13) with states for which there was no effect of inflation on voting preference.
For details, including R and Stata code, go here.
@NateSilver538 Or, to change the inference, one would have to replace about a third of the states (13) with states for which there was no effect of inflation on voting preference.
For details, including R and Stata code, go here: https://t.co/Eq1sUIQjFl
@NateSilver538 Nate mentions that there may be confounders that are unobserved. An omitted variable would have to be correlated at about .4 with inflation and with preference for Trump to nullify statistical significance.
I will be teaching an ICPSR Summer Workshop, "Sensitivity Analysis: Quantifying the Robustness of Inferences to Alternative Factors or Data", https://t.co/7BwKKUcPOL.... July 8-12, 2024. Hybrid (virtual, FtF in Ann Arbor, MI, with asynchronous access to materials).
This workshop is about the statistical tools (R, Stata or the konfound-it app https://t.co/Eq1sUIQjFl) to do just that, quantifying the strength of evidence to inform policy, practice, or general social science.