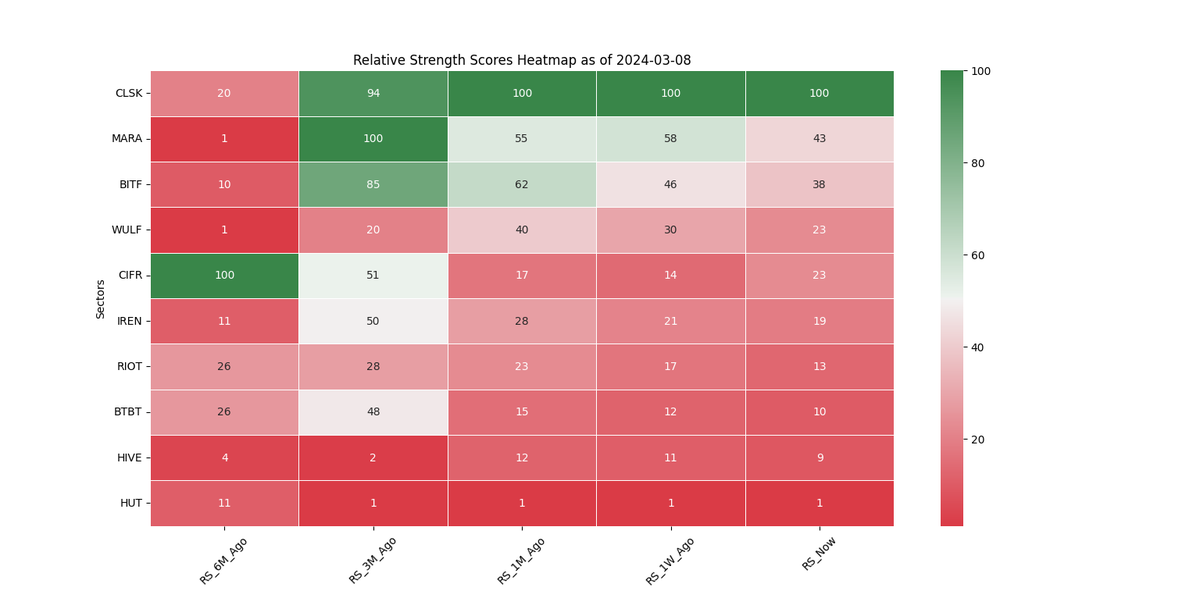
It looks like it was a good decision two weeks ago to sell all of my $MARA stacks and buy $CLSK instead
Now our core miners positions are $CLSK $WULF $CIFR $BTBT
i analyze a lot of other asset classes but i keep mentioning miners just because they are the strongest sector so far...holding the strongest relative strength assets is so so important to financial success
i will cover more and more sectors and asset classes when the time is ready and when i have more time these two quarters creating more visualization. Hopefully can increase my tweet frequency
while stock market and crypto market are cruising towards another ATH and everyone is saying they will TP their crypto gains in 2025, i do feel like the clock is ticking, some threats upcoming:
- 10y-2y yield curve (from the snapshot) forming a double bottom and uninverting
- Bank of Japan will likely pull the plug of negative interest rate in Apr -> carry trade will no longer become as attractive and lead to unwind of levered positions (if you look back to the past financial crisis BoJ also made some important decisions that led to significant market volatility)
- some recent downward revisions of economic data, signalling the economy has been weakening
if I am a market maker i will try my best to pump the crypto market ASAP riding on the spot ETF wave in the few months before the real crash. We may just have a few months of bull market left. Will pay close attention to different indicators closely
$CLSK continues to show the strongest relative strength across miners, while other miners are losing momentum vs $CLSK - therefore I've consolidated my $MARA position early last week (weak after ER + dilution news) into $CLSK as my core position.
Once $BTC blasts through ATH, the opportunity cost of holding weaker miners become higher and higher.
still holding $WULF $BITF $BTBT though hopefully will see some magic, but position size is less than half of $CLSK
#miners#bitcoin $BKCH $BLOK $WGMI Bitcoin, Miners and Blockchain related ETFs continue to show the strongest relative strength versus other thematic ETFs
last week's miners performance is quite disappointing, one hypothesis is as Bitcoin ETFs are now widely available, institutions are no longer required to buy bitcoin proxies (like miners, $MSTR, etc).
This also shows the importance of not putting all eggs into one basket (fortunately my $HOOD $COIN positions are doing quite well, my crypto portfolio like $FET $DOGE $PEPE that i bought at the bottom are also outperforming), anyhow i'm still holding $CLSK $MARA $BITF $WULF $BTBT
imo is important to observe miners' performance when $BTC surpasses ATH, if miners still don't respond, i would consider switching some positions to $IBIT, as opportunity cost is getting higher and higher when $BTC breaks ATH. Nonetheless I'm still hopeful that some miners like $BTBT and $WULF will catch up - Blackrock has been increasing their ownership in the past few months, maybe they see sth that we don't, and i still believe patience will be rewarded
$WULF / $BTC ratio - forming a very strong base at the bottom of the range, if the ratio shoots up to 0.0004 and $BTC reaches $100,000, the implied price of $WULF will be $40, which is its prior ATH. Not sure if it will happen, but even if it reaches $20, it's like 10x from here. I have a position in $WULF as a huge potential catch up play
this is a relative strength chart showing the relative strength of bitcoin miners vs $SPY - two key insights:
(1) $CLSK, $BITF, $MARA has been leading the rally during the $BTC bull run from last Oct, so they will likely lead this run for a while longer
(2) if you look at the RS score 100 level, you can see miners take turn to lead the market historically. So for some smaller miners like $HUT $BTBT $CIFR, even though they are currently lagging, they had taken the lead some time before. imo they will catch up when $BTC approaches previous ATH. Therefore I also hold some position in smaller miners like $BTBT and $WULF as a huge potential catch up play
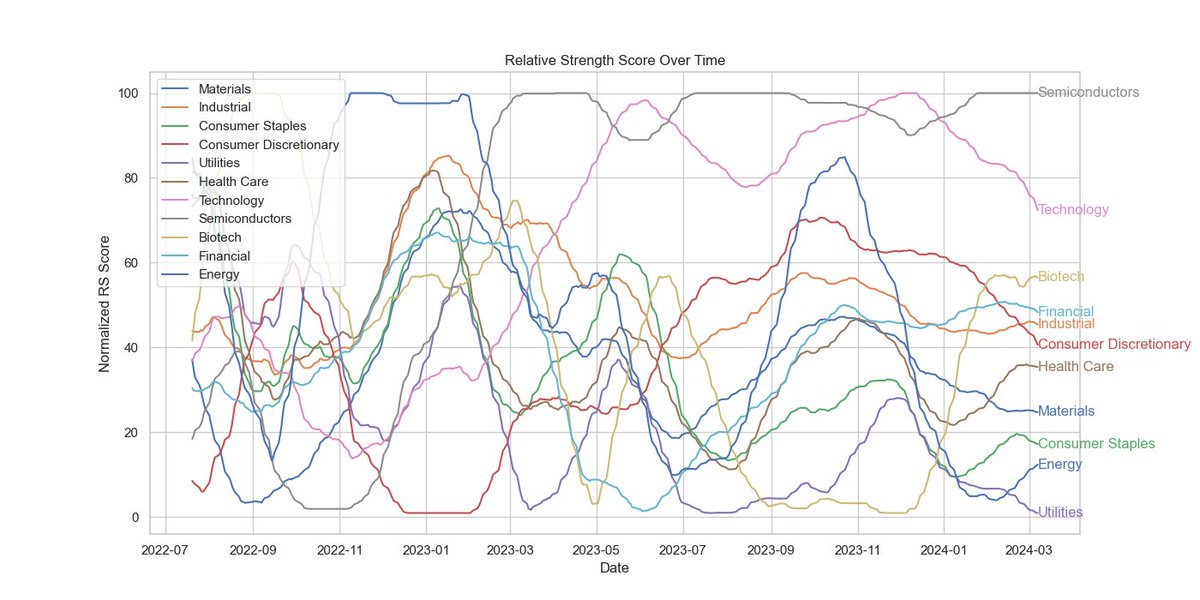
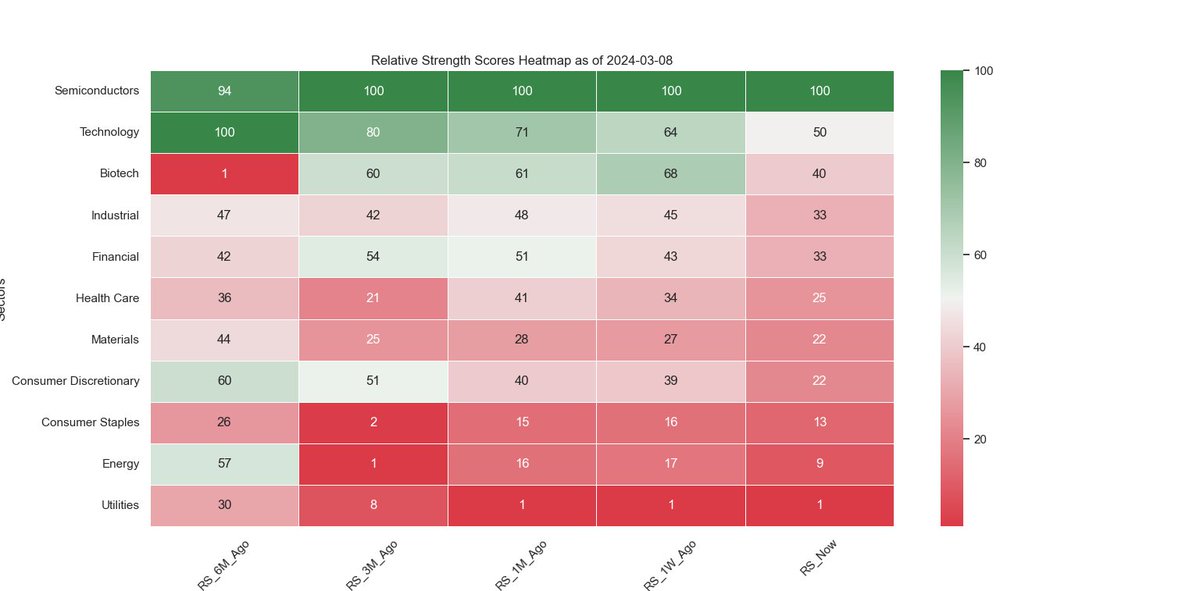
another visualization similar to last tweet - relative strength heatmap of US sectors ETF vs $SPY, semiconductors ($SOXX $SOXL) remain strong thanks to $NVDA, but tech ($QQQ $XLK) is weakening
Looking into Relative Strength of US Sectors vs $SPY, obviously semiconductors ($SOXX $SOXL) and tech ($QQQ $XLK) are leading. However, is worth to pay attention to defensive sectors like health care ($XLV) and consumer staples ($XLP), as they are gaining strength while tech ($QQQ $XLK) are weakening - may signal a correction is near
$COIN / $BNB ratio - $COIN will likely outrun $BNB in this cycle as it got legitimized. If $BNB reaches its previous ATH of $660, and this ratio hits 0.7, the implied price of $COIN will be $465 - not far away from the $500 target implied by the $COIN / $BTC ratio
$COIN - wyckoff accumulation pattern, holding $160+ level, if $BTC runs again it will blast through $200 quickly. $COIN will be benefited more in this bull run by the Binance US shutdown + they are the custodian of most of the Bitcoin ETFs - $COIN is a must have asset in my portfolio to ride on this $BTC bull run
Historically when rolling alpha vs $BTC reaches over 1.8% level, it's overextended vs $BTC and usually signals a local top, will take some profits off the table at that time