Levels - How I draw
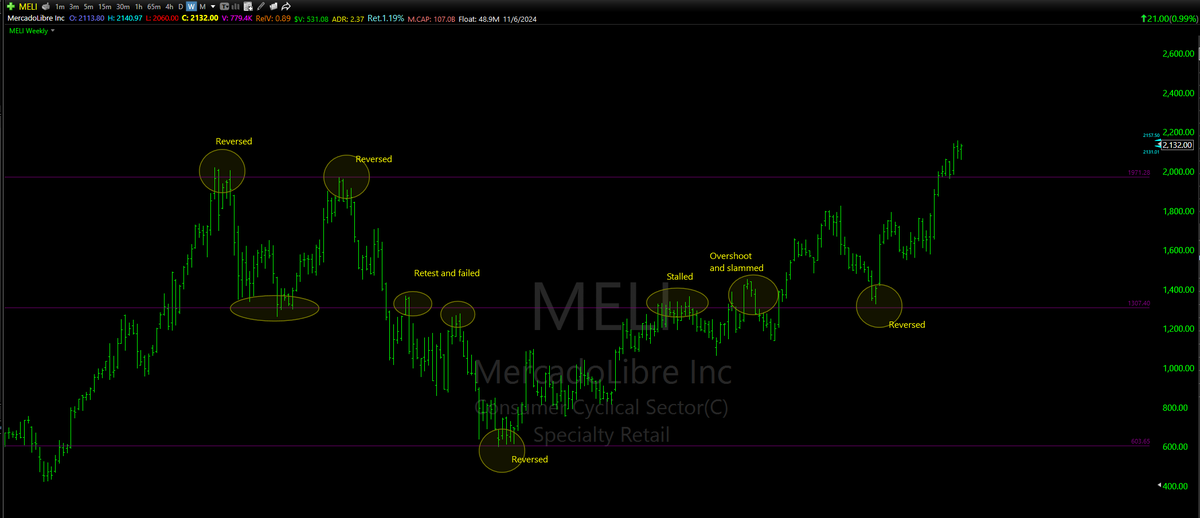
1. Horizontal lines (purple lines) - Where the price stalled or reversed. It can overshoot a little as well and then reverse. I use weekly chart - These are the major areas where action will happen
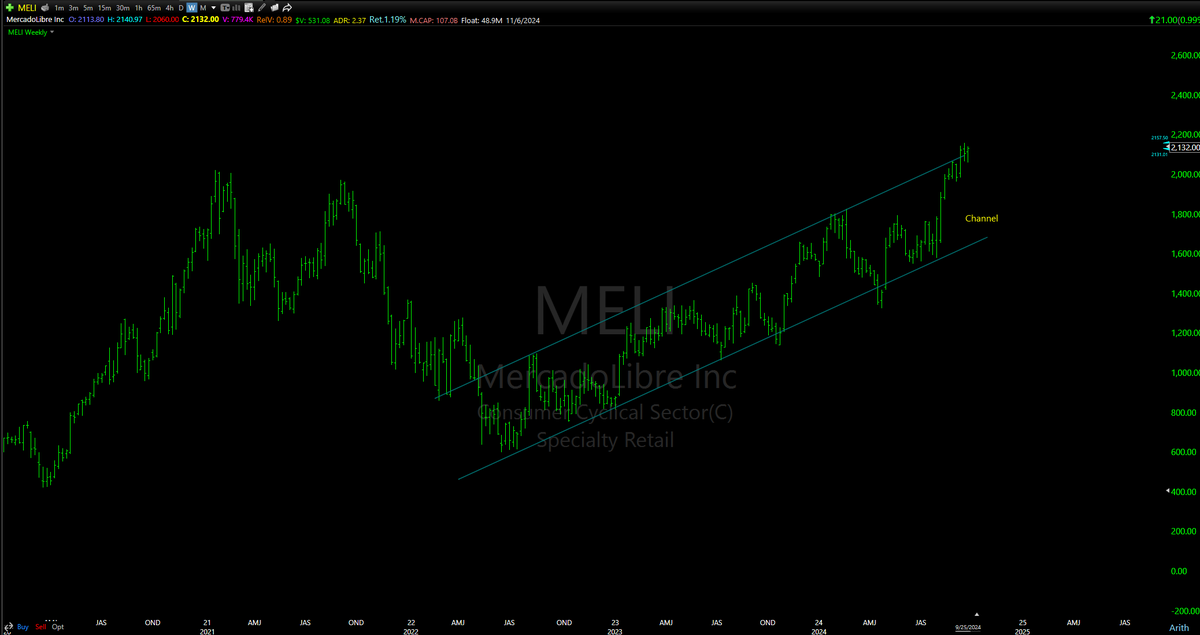
2. Identify channels blue line(only the latest required) - The channel can be horizontal, rising or declining - Chart-3
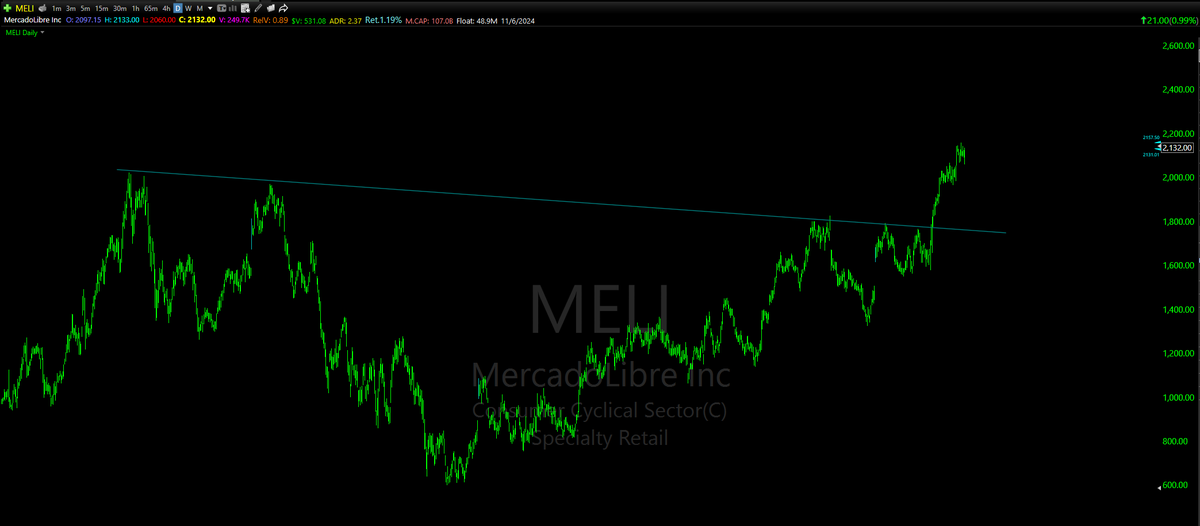
3. Trendlines - Blue line - Connecting swing highs or swing lows that are not part of the channel
4. Gaps - mark the unfilled gaps on daily chart (Yellow Box)
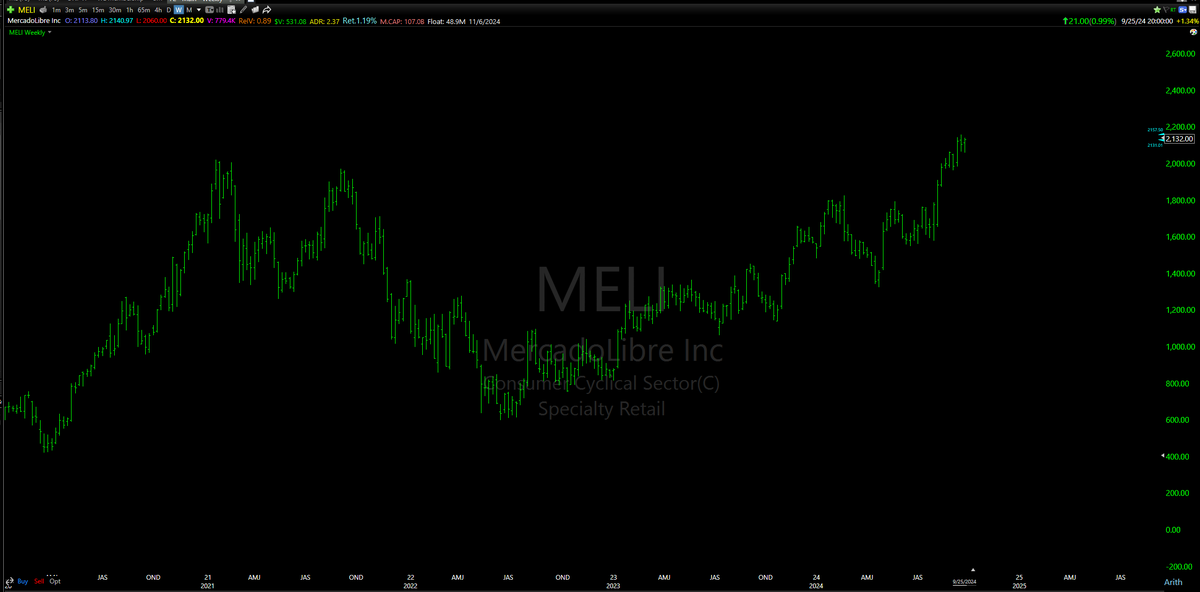
Chart-1 - $MELI (no Levels)
Chart-2 - Horizontal lines Lines based on #1
Chart-3 - Latest Channel
Chart-4 - trendlines
@MrBeast MSM/legacy media would rather publish articles that garner more clicks and attention (basically money) at the expense of people's well-being than the truth
@AmitCzitron @mmonis I think his posts are really valuable for people who can understand his thought process without him explaining too much such that everyone understands. Unfortunately, most of us (including myself) doesn't.
@SawyerMerritt Looking at the comments it seems like majority still doesn't understand how crucial the votes are. There's a reason why Tesla rather spend on ads encouraging votes over advertising for their products.