This is fantastic.
I'm curious though about what seems like a simple feature.
It would be great if the terminal could interact with existing watchlists and screens.
I would love to be able to ask it "what percent of *existing watchlist* moved up vs down today"
Or "what was the average % gain on stocks in *existing watchlist*
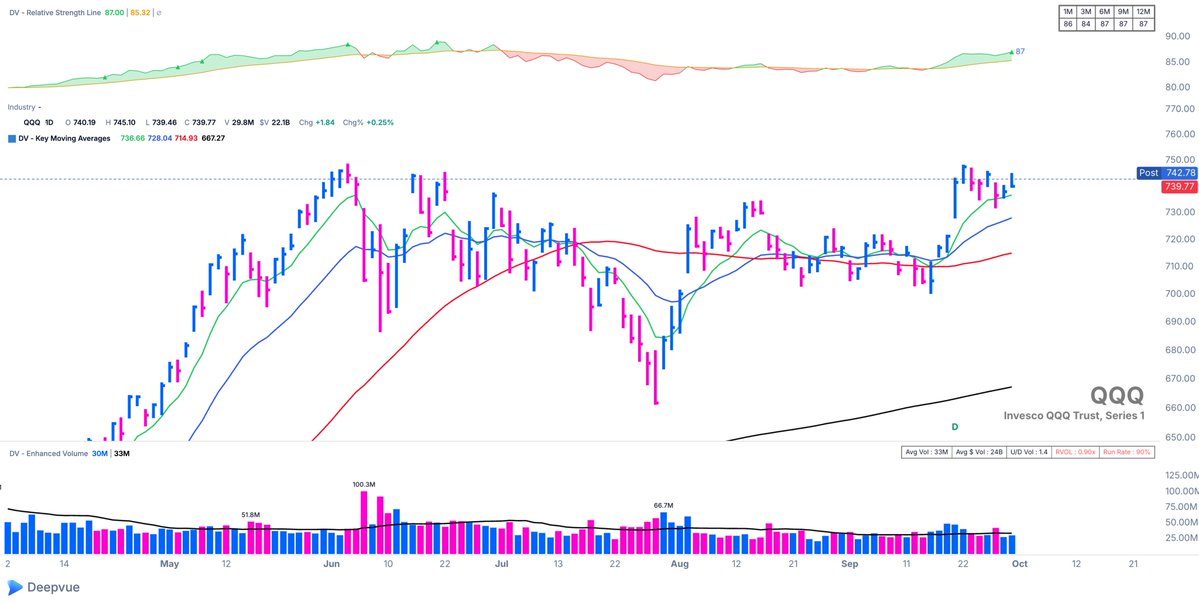
The difference between $QQQ and $RSP is wild.
$QQQ is sitting about 1% from its high.
Meanwhile, the average stock in the S&P 500 is 21.2% below its 52-week high.
That is a massive divergence beneath the surface.
Stats:
Mean: -21.20%
Median: -17.82%
25th percentile: -29.07%
75th percentile: -12.27%
Furthest below 52-week high: -78.42%
Closest to 52-week high: -0.06%
I saw someone else post a chart of this, and I went back to share it but couldn't find it.
Full disclosure to all twelve people that will see this: I'm not taking credit for this
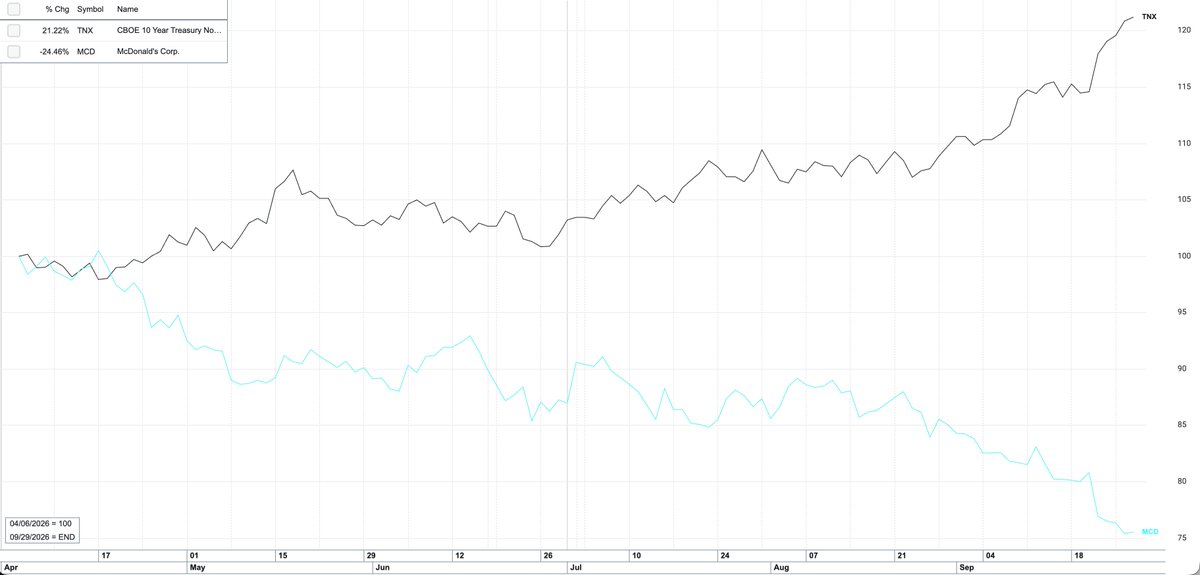
$TNX $MCD
Just an interesting chart to consider.
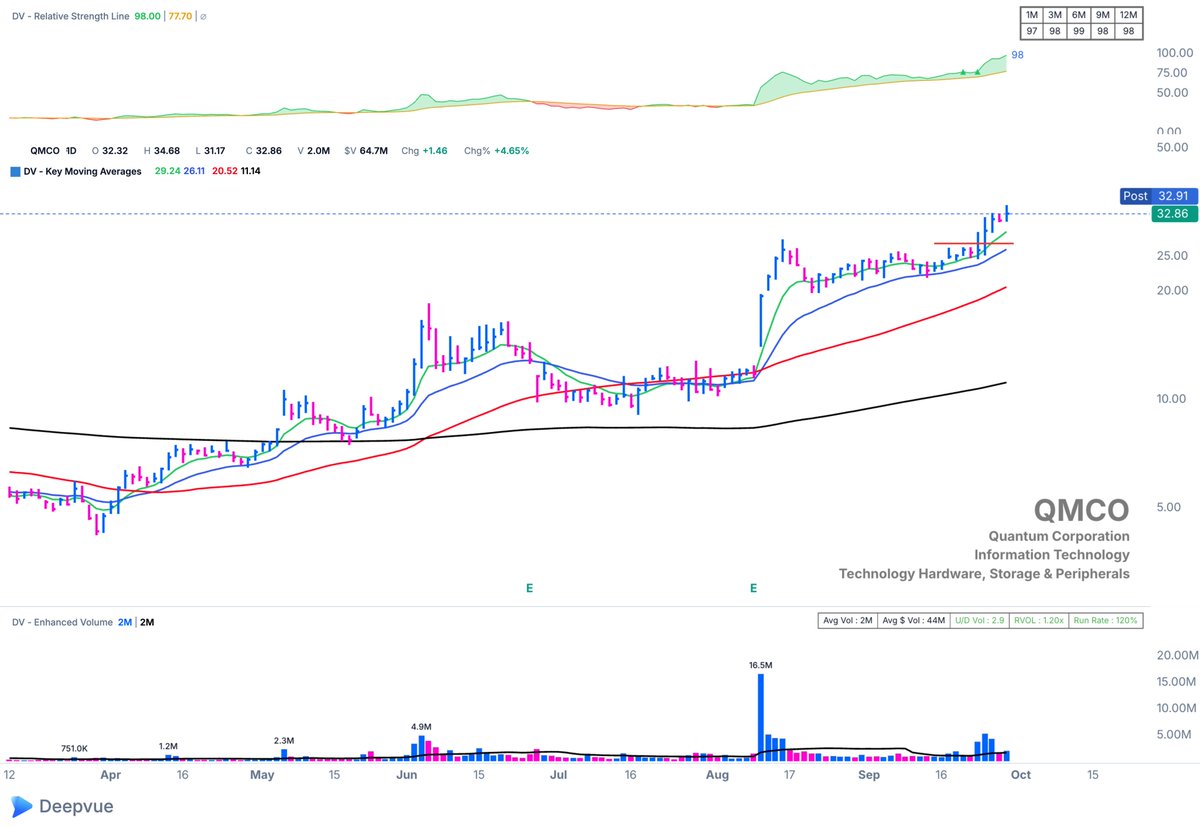
$QMCO
Started buying yesterday at $26.67 with what I call an "explosive action continuation setup" or EAC.
I was obviously not a fan yesterdays hard squat and closing the day on down on the position a smidge.
Great action today though, added a couple times into today's strength, nice close.