Social network analysis (SNA) measures are a vital tool for understanding the behavior of networks and graphs. We take a look at some SNA measures, detailing how they work and when they should be used in your network analysis applications https://t.co/zGLHBTJGyu
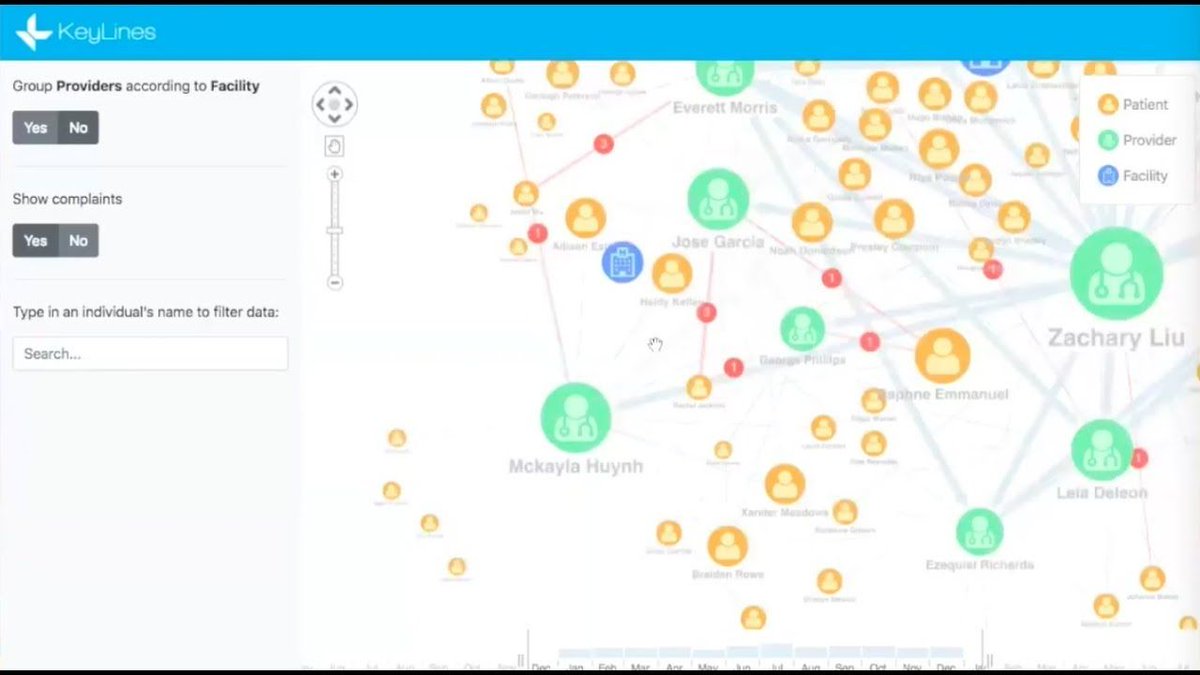
With data being collected & stored in disparate systems, #DataSilos pose a big challenge for many organizations trying to achieve #Customer360. This webinar demonstrates how graph visualization can pull this information into a single consolidated view https://t.co/9IyMg7tmBi
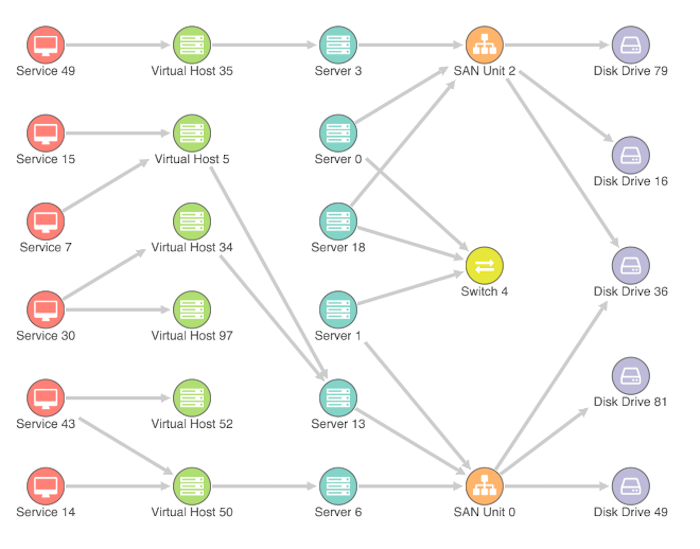
Layouts are a crucial tool in graph visualization. Use the wrong one and you can ruin your visualization. If your data needs to be placed in tiers, our sequential layout is your go-to https://t.co/RGywGmv9pT
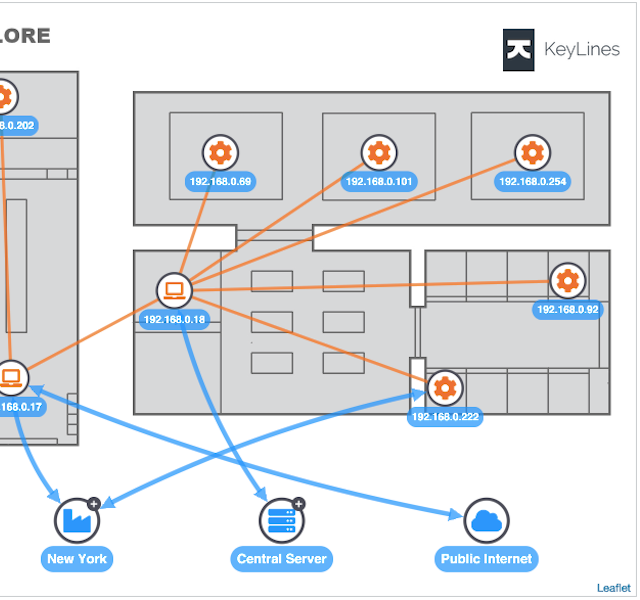
Wouldn't it be really handy to visualize your organization's IT infrastructure as a floor plan like the image below? Let us show you how in this tutorial - presenting graphs on images https://t.co/qNwv7m9RhO
We shine the spotlight on @StardogHQ to show how easy it is to integrate their enterprise knowledge graph technology with KeyLines. Lights, camera, visualize! https://t.co/ldgkBpa9Bf
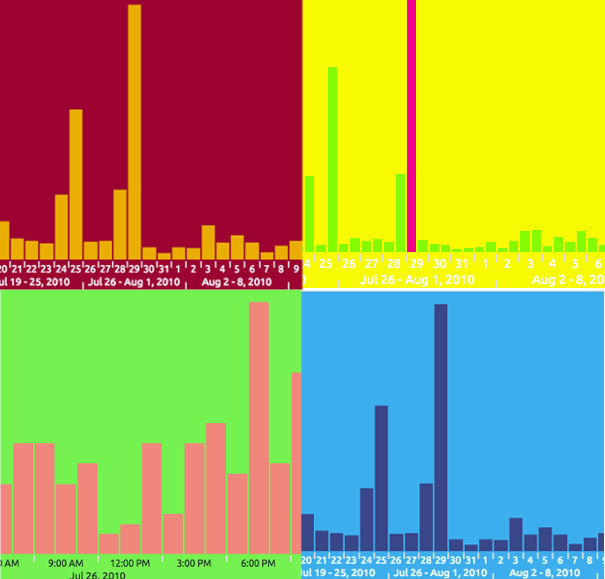
Whether you're an experienced time series database user or a novice, this blog post should provide some great insight. We integrate KeyLines with #InfluxDB to bring the #Nodobo mobile phone usage time-series data to life https://t.co/9TYwrKx3hC
The time bar is a great way to understand temporal trends in your dynamic graph data. We take a closer look at this powerful bit of functionality to see how it works and how to incorporate it into your applications https://t.co/3A0cyaNDlN
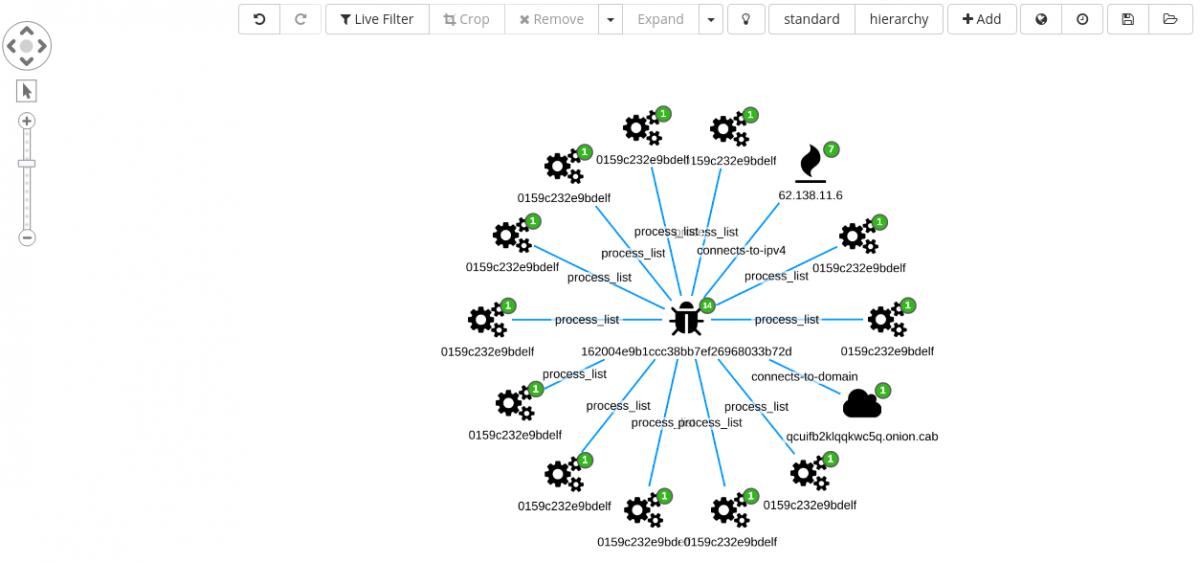
Want to see KeyLines in action? Check out this @sirensearch blog post. By the end of it you'll have better a understanding of how graph visualization can help you day-to-day data exploration and analysis workflow https://t.co/Efj7ZyvfEv
Whether you’re investigating fraud rings, managing infrastructure or trying to uncover crime patterns, you’ll find a wealth of insight buried in your geospatial connected data. Watch our "Geospatial graph insight without limits" webinar here: https://t.co/vyEfVZZGqD
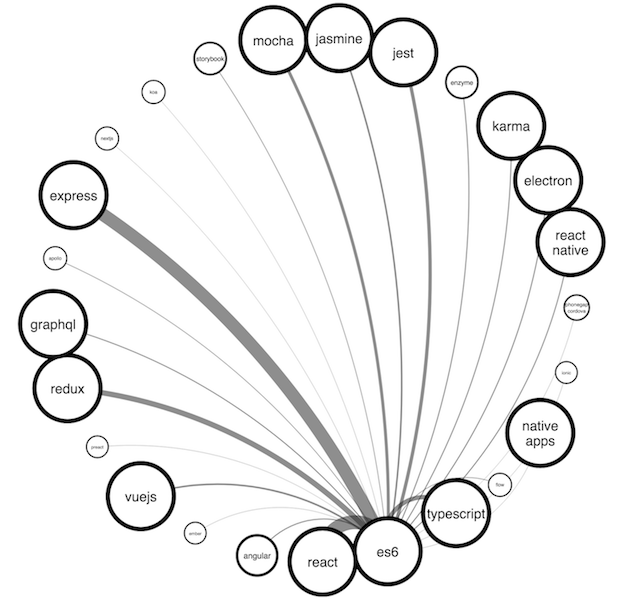
Done well, #chorddiagrams can provide a compact, economical way to represent complex data. In this post we show you how to bring them to life with KeyLines https://t.co/6GGKOOhZSK
KeyLines offers the flexibility to position graph items on any kind of background image. You can choose the view that'll make most sense for your users: floor plans, building layouts, virtual representations & IT infrastructures, for example. See how here: https://t.co/qNwv7m9RhO
Whether you work with React, Angular or JavaScript we've got you covered. We’ve revamped our developer tutorials so you can get started with KeyLines more quickly and easily https://t.co/4hbPeCkPLc
There are so many visualization options to choose from. In this post, we examine the pros and cons of one popular choice: chord diagrams https://t.co/6GGKOOhZSK
Visualizing graph data in context with background images is a great way to understand at a glance what’s really going on in your data. Follow this KeyLines tutorial to see how you can present graphs on images https://t.co/qNwv7m9RhO