Let's celebrate another great ASUG year - December 5th from 5:30pm - 8:30pm at the SAP Offices in Atlanta.
Join the @ASUG_Georgia Chapter for an evening of networking, music and fun. Appetizers and drinks will be provided.
https://t.co/z1MbI205Mi
Integrate Amazon AWS S3 Storage with #On-Prem Data from @SAP#DataServices: You've got #BI initiatives running on prem. You've begun storing data in the cloud. Now it would be great to pull that cloud data into your analytics for more insights. How? https://t.co/RGTqd9mJEL
Take advantage of a free day of learning from some of the top #BI experts around and networking with peers. Join us September 7th at the @ASUG_Georgia Chapter Fall meeting in Atlanta. No membership needed. See you there! https://t.co/yYvD2r2lD6
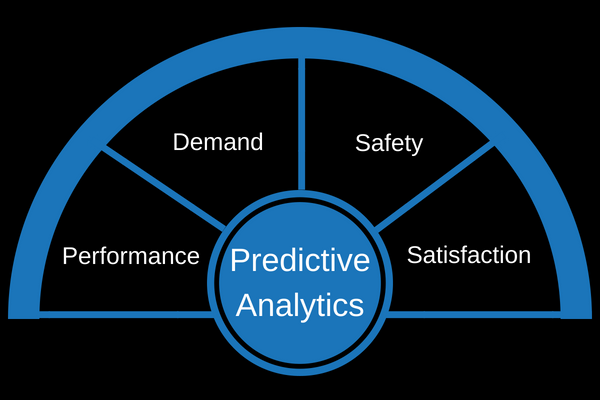
Improving Operations with Predictive Models: The cost benefits of using predictive analytics to analyze historical and current data, using rules and predictive models, to anticipate future events. #SAP@SAP#BusinessObjects#PredictiveAnalytics https://t.co/bO4jiUUkGr
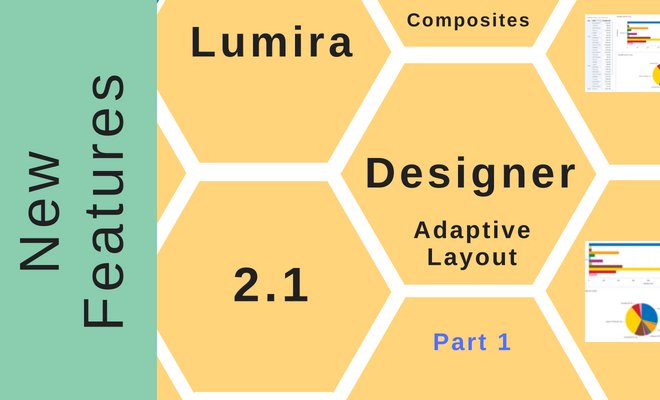
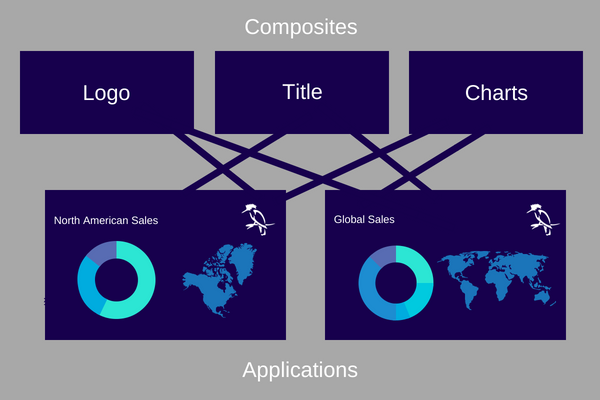
You can reuse the same composite in multiple @SAP#LumiraDesigner dashboards, providing consistency and saving huge amounts of development time. #BusinessObjects#SAP https://t.co/XRbNJCBUCS
The Adaptive Layout Component in @SAP#LumiraDesigner: Adaptable to whatever size device on which you are viewing your application: large screen, phone, etc. #BusinessObjects https://t.co/IPOG9BeVDI
Dashboards for Utilities: Real-time insight for decision-makers with dashboards based on company strategy. Consider regulation, infrastructure monitoring, operations, financial or customer dashboards. Few ideas to consider for each. https://t.co/GbMfKQhMcx #SAP#BusinessObjects
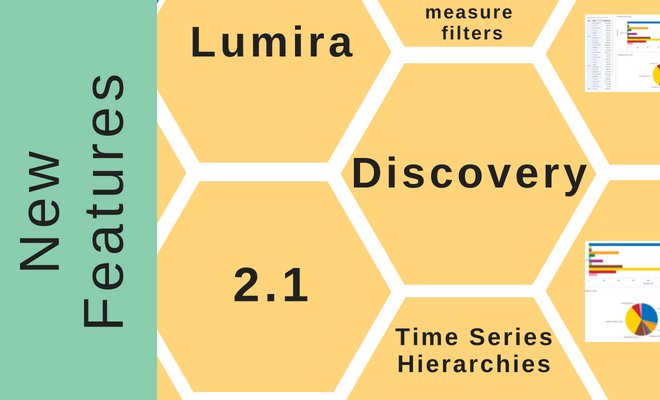
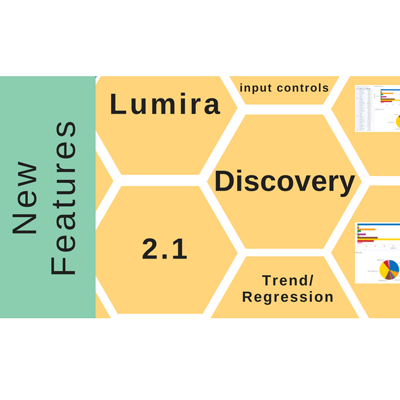
Measure Filters, Time Series Hierarchies in @SAP#Lumira 2.1: One of the most glaring disappointments of Lumira 2.0 was not being able to filter on measures. In Lumira 2.1, this has been added and, as expected, it’s an easy feature to use. https://t.co/p9UEgtPNaw
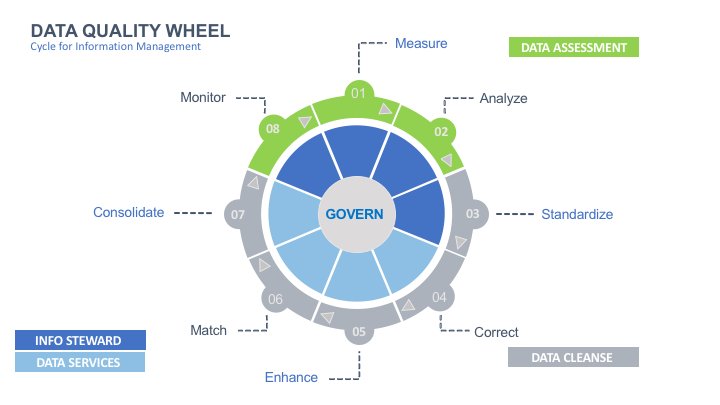
#DataQuality in #Utilities: Basics apply regardless of industry. 60% of organizations don’t measure financial cost of poor #DQ. For utilities, poor DQ accounts for 20% of process costs, affects labor productivity by 20% and operational expenses by 20-30%. https://t.co/VUJTCSWj48
Add Your Corporate Identity to #Dashboards
Use #LumiraDesigner Composites to Create a Logo Header
Using composites wisely can reduce dashboard development time by creating modular features and reusing these composites in many different places. https://t.co/gvj996NcZq