Fed the IREN-Microsoft deal with some of my questions into ChatGTP SOL on Ultra to see what Horizon 1 delivery and acceptance will actually mean for IREN and what it would imply for share price . $IREN
Many are saying Horizon 1 delivery is already baked in/ should not move the price , what I found shows this is no where near true and this would be the start of the actual rerating.
"The next decisive proof point is Microsoft accepting Horizon 1. Microsoft’s formal acceptance is the event that actually unlocks the economics. "
Key wording is how they announce.
"Handoff vs acceptance".
- Handoff implies that Microsoft still has to test H1 and then accept it ( 4-5 day window from handoff to acceptance)
-Acceptance means that testing has already been completed and revenue is being generated
Why Horizon 1 matters so much:
1 . It activates real Microsoft revenue. Until acceptance, the $9.7 billion headline is largely a future contractual opportunity. The company cannot bill monthly for a tranche until the minimum capacity is accepted.
2. It moves contracted value into reported backlog.
3. It is roughly one-quarter of the Microsoft project. A simple one-quarter estimate would give Horizon 1 about $2.4 billion of total contract value and approximately $485 million of annualized revenue once fully operational.
4. It validates IREN’s construction capability. Successful delivery demonstrates that IREN can build, cool, network and operate a hyperscale GB300 cluster. Horizons 2–4 then reuse much of the same design, supply chain and construction process.
5. It validates the project financing. The GPUs and Microsoft cash flows secure billions of dollars of project debt.
What does this imply for IREN's share price?
Possible one-day IREN share price reaction based on only financing validation of Microsoft contract for H1
- Full H1 accepted; billing commenced; H2–4 reaffirmed
+6% to +15% or Share Price : $35.60–$38.70
- Full acceptance plus accelerated H2-4
+15% to +25% or Share Price: $38.70–$42.00
This did not account for IREN's high short percentage (26.7 % of float according to Robinhood as of July 16th). As such, I reframed the question to account for this short percentage.
Share Price Reaction after July 19 announcement with short percentage accounted for.
- Clean full acceptance with modest covering: $39–$44
- Acceptance plus 10%–25% covering: $42–$48
- Strong squeeze with 25%–50% covering and options reinforcement: $46–$58
- Forced-covering cascade: $60–$75+, but likely temporary and still a low-probability outcome
The most meaningful change is that a move through $45 could accelerate much faster. Many shorts likely have profits from IREN’s decline through the $45–$60 area. Above $45–$50, those cushions begin disappearing, potentially triggering covering and momentum buying simultaneously.
- Indicators that shorts are covering:
1. Confirmation would mean volume exceeding roughly 100 million shares, the price holding above $45 rather than briefly touching it,
2. borrow availability tightening sharply from its recent inexpensive levels
Summary:
Most probable clean-acceptance close: $39–$44.
A $50 print becomes reasonably plausible.
A sustained $55+ move would require genuine covering confirmation.
July 23rd $IREN — THE BEARS ARE OUT TO PLAY AGAIN
There’s plenty of bearish chatter on X after today’s close:
• IREN: -1.67%
• QQQ: -1.88%
• SPY: -1.23%
Whop-de-doo, rainbow bears.
The former IREN might have fallen 10% on a day like this. But this isn’t the former IREN.
Revenue is coming into view—take a look at @Agrippa_Inv latest post—and Monday’s 20% move showed how quickly the market can reprice IREN when the story advances. Since then, the stock has simply traded in a tight range between roughly $40 and $43.
ACCUMULATION PHASE
- When you light a fuse, the explosion doesn’t happen instantly. The fuse has to burn first.
- That’s what this back-and-forth price action resembles.
- Repeated dips into the $40–$41 area continue to get bought quickly. IREN has always showed increasing institutional participation despite IREN’s famously bipolar price action.
- Why keep accumulating through all this volatility
- Because serious buyers are looking beyond tomorrow’s candle.
SHORT INTEREST ( IMAGE 1)
- Robinhood’s July 22 figure shows approximately 85.5 million shares short, or 27.68% of the float. I am ssuming this is closer to 28% after todays price action.
- short interest has climbed steadily from its June low of 15.88%.
- Stocks don’t always go up—and neither can short interest.
- That positioning is becoming a potential pressure cooker. One meaningful announcement—such as the anticipated H1 acceptance milestone—could force short bears to crawl back into their dens. 🤣
DAILY CHART ( IMAGE 2)
- Yes, I acknowledge today’s candlestick looks ugly.
- Now switch to Heikin-Ashi candles and zoom out. (Thank me later)
- As my crayola TA trendline shows, the broader structure resembles an ascending staircase, with higher lows continuing to form.
- Daily MACD remains bullishly crossed
- Daily RSI continues to show bullish divergence from prior oversold conditions
Wait—I thought we were going to $20???🤣
HOURLY CHART
- Hourly RSI is around 42 ( slightly oversold) after being highly overbought at close on Monday.
- RSI reset without a major price breakdown?
- Cool.....I’ll take that any day.🚀
GAMMA ( IMAGE 3)
- Key Gamma support sits near $40
- An open and hold above $41 could establish another support level
- Resistance appears relatively light until approximately $46
- The negative-gamma zone around $43.50 could amplify a move if reclaimed
MAX PAIN
- And with Friday comes options expiration.
- The reported max-pain level for IREN options expiring July 24, 2026? You guessed it: $40.
- Max pain isn’t a guaranteed destination, but it does help frame the potential for price pinning into expiration.
THE BOTTOM LINE
- Could IREN dip to $39 tomorrow? Absolutely.
- But that could simply deliver another momentum reset before a stronger move. The repeated buying around $40–$41, improving fundamental outlook, rising institutional participation, elevated short interest and intact chart structure all suggest the fuse is still burning.
The bears may be loud.
That doesn’t mean they’re right.
Not financial advice.
My man… you’ve got a gap in your head. (Credit: @BitcoinAIGuy)
Technical analysis can offer guidance, but at the end of the day, you have to look at the actual business.
SoFi fell sharply because of rising interest rates and the Biden administration’s student-loan moratorium. Comparing these companies’ business models at this point is like comparing an apple to a gold bar.
$IREN — Daily Recap
Hopes were high for another push today, but a flat market awaiting GOOG earnings kept the move contained. My broader outlook remains bullish.
Today’s price action
- IREN dipped below $40 in premarket trading on extremely light volume: an apparent stop-loss sweep.
- At the open, algorithmic buying and swing traders drove the stock to an intraday high of $43.72.
- Likely catalysts included analyst upgrades and the daily MACD turning bullish for the first time in roughly six weeks.
- Profit-taking and a flat broader market eventually brought IREN back to nearly unchanged.
- IREN closed at $41.28 versus $41.29 yesterday 🤔
Daily chart — Image 1
- MACD remains bullish after crossing yesterday. The move may still be in its early stages.
- Daily RSI remains relatively subdued.
- Sidenote: Weekly RSI has barely moved despite the stock’s roughly $10 swing, leaving room for further upside)
- For the second consecutive session, IREN failed to hold the key EMA near $42.50. ( also where gamma resistance wall is setup at currenty)
- Volume was even lower than yesterday, potentially reflecting three factors:
1. The broader market was waiting for GOOG earnings. Higher hyperscaler capex could translate into greater infrastructure spending.
2. Shorts do not appear to have covered meaningfully. Volume should increase if covering accelerates.
The afternoon decline occurred on light volume, suggesting an algorithm-driven move rather than aggressive, broad-based selling.
Four-hour chart
- Price remains above the 20- and 50-period EMAs.
- IREN closed just below the 9-period EMA, currently near $41.33.
- MACD remains bullish without appearing overextended.
RSI is around 56—neutral to moderately bullish.
One-hour chart — Image 2
- RSI is relatively neutral at approximately 54.
- MACD became extended following Monday’s push, subsequently reset and now appears to be crossing bullish again.
Gamma positioning — Image 3
- Lower price nodes were cleared during the morning rally but gradually rebuilt as the stock declined.
- The largest negative-gamma concentration sits near $33, currently buffered by substantial nodes around $40 and $41.
- Negative gamma remains above the current price and could provide upward propulsion.
- There is no apparent major upper gamma barrier until approximately $50.
- An open above $42.50 could force dealers to reposition.
Crayola TA — Image 4 🖍️
The 15-minute chart appears to be forming a bullish pennant, creating the potential for an upward move tomorrow—especially if GOOG earnings and its capex outlook provide a positive catalyst as after-hours action is suggesting at this time.
Key levels
$40–$41: Strong support
$42.50: The gate
$43–$43.50: Potential acceleration zone
$50: Next major upper barrier
The structure remains constructive: strong support around $40–$41, a pivotal gate at $42.50 and meaningful upside-acceleration potential above $43.
Now we wait....something has to be on the Horizon...☀️
$IREN — watching the paint dry today. Tomorrow, we release.
After yesterday’s 20% rip, of course we wanted to see the stock keep climbing. But stocks don’t move in a straight line. Sometimes consolidation is exactly what a chart needs before its next move. The broader market ripped today while IREN didn’t.
Bears came out to play.
We are chilling.
1. Hourly chart — Image 1
- RSI moved from deeply oversold to extremely overbought. A cooldown was inevitable.
- Today’s consolidation brought hourly RSI from roughly 80 to 56. God’s work.
- Bears tried to break $40 three times and failed.
- Price held above the 9, 20, 50, and 200 EMAs throughout the day—a sign of strength.
- Hourly MACD is currently bearish, but I’m giving more weight to the daily MACD setup discussed below.
2. Four-hour chart — Image 2
- After reclaiming the 9, 20, and 50 EMAs yesterday, IREN stayed above all three today. Another sign of strength.
-Today’s pause also allowed the 9 day EMA to catch up after lagging well below price following yesterday’s move.
- RSI is getting slightly elevated but remains healthy at approximately 61.
3. Daily chart — Image 3
- MACD: LOOK AT THAT GREEN BAR. 🌊
- The daily MACD has finally crossed bullish after six weeks.
- Every major IREN rally following a dip has begun with a daily MACD turnaround.
- This is the kind of signal that can attract swing traders, hedge funds, and algorithmic buying.
- Normally, I wouldn’t expect an immediate reaction from the MACD cross alone. IREN has previously traded sideways even after bullish crosses.
- But with a potential Horizon 1 acceptance announcement approaching, I believe the reaction could be much faster this time!
RSI
- Daily RSI still has plenty of room to run.
- IREN continues to hold the 9 EMA.
- Price tested the 20 EMA and was rejected, but today was never likely to be the real move after yesterday’s 20% surge.
5. Gamma exposure
- During the afternoon dip, the negative-gamma nodes at $34 and $39 grew, pulling price downward as put activity increased and shorts likely added to their positions.
- After 3 p.m., the positive $40 gamma node increased by almost $600k in exposure ( essentially acting as a supprot for price action). That support helped shield price from the large negative-gamma area at $39—while the stock was also oversold across nearly every sub-hourly timeframe.
- The closing setup shows support walls around $41 and, more significantly, $40.
- Multiple negative-gamma strikes sit above the current price. If IREN starts moving higher, those levels could add fuel to the move—especially if volume arrives alongside the daily MACD cross.
- There is almost no visible upper resistance, which would typically appear as a positive-gamma node above the current price.Dealers appear hesitant to cap the upside. It’s almost as if they know Horizon 1 acceptance may be coming—and that a short squeeze could follow.
6. Shorts
- After yesterday’s 20% gain, I assumed the previously reported short-float figure of approximately 26.6% would decline.
- Instead, shorts appear to be doubling down. Yesterday’s figure reportedly came in near 27.1%.
- Today’s updated data is not yet available, but I suspect short interest may have climbed above to 28-30% during the afternoon dip.
- If IREN announces Horizon 1 acceptance......LOL
CHATGTP SOL Ultra Projecitons
- Full Horizon 1 acceptance, no additional news
+7–15%: $44–$47.50
- Acceptance plus H2–H4 acceleration or Microsoft expansion+20–35%: $49.50–$55.75
Yesterday was the breakout. Today was the reset.
Hourly momentum cooled, key moving averages held, $40 survived repeated attacks, and the daily MACD finally crossed bullish—all while shorts continued pressing their bets.
We are chilling.🤔
Not financial advice.
Fed the IREN-Microsoft deal with some of my questions into ChatGTP SOL on Ultra to see what Horizon 1 delivery and acceptance will actually mean for IREN and what it would imply for share price . $IREN
Many are saying Horizon 1 delivery is already baked in/ should not move the price , what I found shows this is no where near true and this would be the start of the actual rerating.
"The next decisive proof point is Microsoft accepting Horizon 1. Microsoft’s formal acceptance is the event that actually unlocks the economics. "
Key wording is how they announce.
"Handoff vs acceptance".
- Handoff implies that Microsoft still has to test H1 and then accept it ( 4-5 day window from handoff to acceptance)
-Acceptance means that testing has already been completed and revenue is being generated
Why Horizon 1 matters so much:
1 . It activates real Microsoft revenue. Until acceptance, the $9.7 billion headline is largely a future contractual opportunity. The company cannot bill monthly for a tranche until the minimum capacity is accepted.
2. It moves contracted value into reported backlog.
3. It is roughly one-quarter of the Microsoft project. A simple one-quarter estimate would give Horizon 1 about $2.4 billion of total contract value and approximately $485 million of annualized revenue once fully operational.
4. It validates IREN’s construction capability. Successful delivery demonstrates that IREN can build, cool, network and operate a hyperscale GB300 cluster. Horizons 2–4 then reuse much of the same design, supply chain and construction process.
5. It validates the project financing. The GPUs and Microsoft cash flows secure billions of dollars of project debt.
What does this imply for IREN's share price?
Possible one-day IREN share price reaction based on only financing validation of Microsoft contract for H1
- Full H1 accepted; billing commenced; H2–4 reaffirmed
+6% to +15% or Share Price : $35.60–$38.70
- Full acceptance plus accelerated H2-4
+15% to +25% or Share Price: $38.70–$42.00
This did not account for IREN's high short percentage (26.7 % of float according to Robinhood as of July 16th). As such, I reframed the question to account for this short percentage.
Share Price Reaction after July 19 announcement with short percentage accounted for.
- Clean full acceptance with modest covering: $39–$44
- Acceptance plus 10%–25% covering: $42–$48
- Strong squeeze with 25%–50% covering and options reinforcement: $46–$58
- Forced-covering cascade: $60–$75+, but likely temporary and still a low-probability outcome
The most meaningful change is that a move through $45 could accelerate much faster. Many shorts likely have profits from IREN’s decline through the $45–$60 area. Above $45–$50, those cushions begin disappearing, potentially triggering covering and momentum buying simultaneously.
- Indicators that shorts are covering:
1. Confirmation would mean volume exceeding roughly 100 million shares, the price holding above $45 rather than briefly touching it,
2. borrow availability tightening sharply from its recent inexpensive levels
Summary:
Most probable clean-acceptance close: $39–$44.
A $50 print becomes reasonably plausible.
A sustained $55+ move would require genuine covering confirmation.
$IREN Horizon H1 buildout timelapse 🔥
Just look at the absolute scale of this thing.
This is just 50 MW of the total 200 MW of Microsoft-contracted AI power. It looks like this in real time.
FYI @IREN_Ltd has 6GW of secured power.
$IREN — well, well, well…
We got our squeeze—even without the H1 handover announcement. So what happens when that catalyst finally arrives?
🐂 The bullish technical setup:
1. The 2B reversal is confirmed
The reversal highlighted in my previous post has now played out.
2. Volume is back
Friday’s close delivered meaningful volume, and approximately 90 million shares traded today. The sharp move likely forced some shorts to cover, adding fuel to the rally.
3. A daily MACD crossover is approaching
This remains the key signal for the next potential leg higher. Significant progress was made today, and another session above $40 could push the MACD into bullish territory.
That would be a powerful momentum signal—one that could attract further algorithmic and momentum-driven buying if accompanied by strong volume.
4. The $63 gap remains open
There is still a significant unfilled daily gap near $63. Gaps are never guaranteed to fill, but this could become an important upside target if momentum continues.
5. The daily 9-EMA has been reclaimed
$IREN reclaimed its daily 9-EMA—the green line on the chart—for the first time in roughly six weeks. That provides further evidence of a potential trend reversal.
6. Gamma
-Options gamma has always been a strong indicator for IREN direction.
- Postive gamma at $40 acting as support at this time ( I can see this increasing tomorrow with current afterhours pricing of $41.56)
-Negative gamma nodes above at $42, $43, and $45 if price moves toward them they will act as propulsion to fuel rally upwards even further.
- Positive gamma at $50 grew over the course of the day today, potential roof for this weeks movement.
7. Now add the catalyst
All of this is happening before the anticipated H1 handover announcement. If that news arrives while volume and momentum remain elevated, the setup could become even more compelling.
The bulls have momentum. Now they need to defend $40 and confirm the breakout. A genuine squeeze would likely require $IREN to clear the $48–$50 zone on more than approximately 120 million shares of volume.
The setup is there. Now price and volume need to confirm it.
Not financial advice—manage your risk.
12 months ago we had ~3MW of self-built AI Cloud capacity. Today: 480MW being delivered this year, $2.8bn in new contracts signed, and our 2026 ARR target raised to $4bn+ with ~85% already under contract.
Demand continues to exceed everything we can build. Recent contracts include customer prepayments covering ~45% of the associated GPU capex, with weighted average contract terms of ~4 years across the portfolio.
Data centers. Compute. Software. The three-layer thesis, executing as written:
https://t.co/VP7KeVpV3F
We're in a good spot. Proud of the team.
IREN has signed $2.8bn in new multi-year AI Cloud services contracts with leading AI developers and raised its year-end 2026 AI Cloud ARR target from $3.7bn to over $4.0bn.
“Our vertically integrated AI Cloud platform is scaling at pace. In the past 12 months we have expanded from approximately 3MW of self-built AI Cloud capacity to 480MW being delivered this year, with 1.2GW targeted for 2027, broadening our customer base across hyperscalers, enterprises and AI developers.”
“We are proud to support leading companies building frontier applications across design, physical AI and robotics, generative media, AI search and model development.” - @danroberts0101
Press release: https://t.co/7W3Ze0JThN
$IREN: Positive technicals leading into Horizon 1 delivery to Microsoft
Now let’s look at the positive technical setup leading into Horizon 1 delivery to $MSFT.
Several signs of bottoming and a potential trend reversal are beginning to appear. None guarantees a reversal on its own, but together they could become highly additive if the Horizon 1 handover acts as the catalyst.
1. Four-hour 2B reversal pattern — Image 1
- A 2B reversal signal appeared on the four-hour chart around $38.50 and has remained there since Thursday, July 18, when the selloff below $38 began.
- The last time IREN produced a 2B reversal signal on the four-hour was in October 2025.
- I fully expect the $38.50 level to be revisited eventually.
- If that move coincides with the Horizon 1 handover to Microsoft, the recovery could happen much more quickly.
2. Volume increase into Friday’s close — Image 2
- On Friday, the final closing candles on the 5-minute, 10-minute, 15-minute, 30-minute and one-hour charts all printed their highest closing volume since June 6, excluding the Russell inclusion candle.
- Were shorts covering—or adding?
- The next few sessions should give us the answer.
3. Monthly 50 EMA support — Image 3
- On Friday morning, IREN reached a low near $32, essentially touching the monthly 50 EMA—the yellow line on the chart.
- IREN had been significantly overextended above this EMA since its run began in June 2025. Returning to this long-term support could indicate that the broad $30–$70 consolidation range is finally approaching its conclusion.
- Again The timing is especially interesting because it coincides with the approaching Horizon 1 delivery and the expected ramp in IREN’s AI revenue.
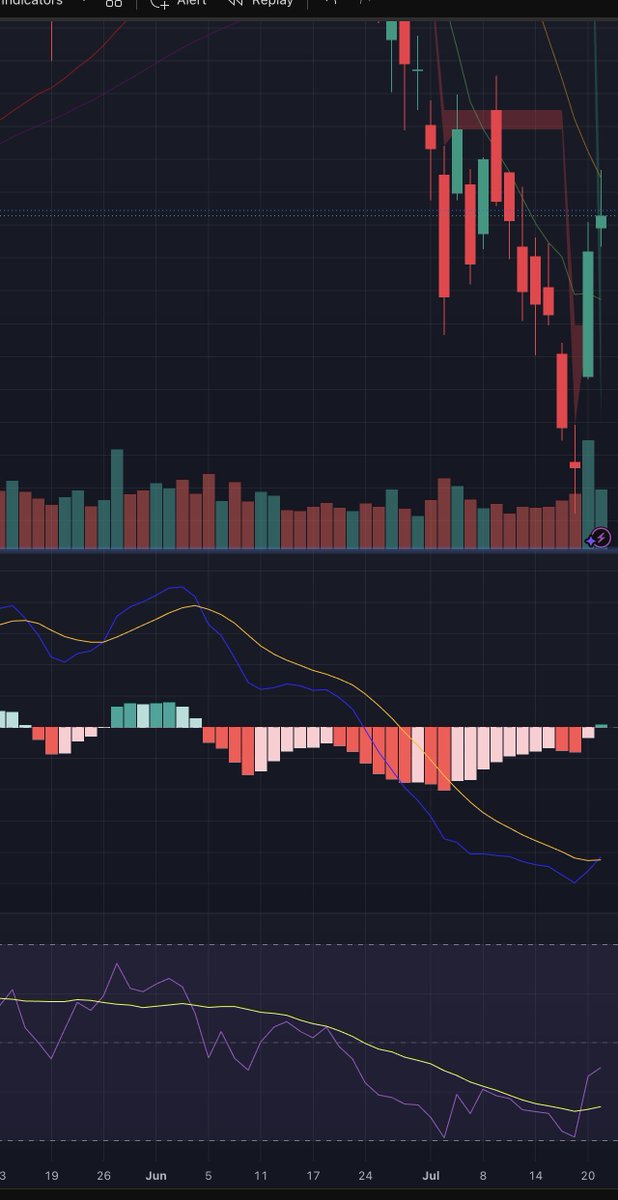
4. Daily MACD crossover — Image 4
- The daily MACD is now deeply bearish, with readings comparable to the December 19 lows.
- The confirmation we need is a bullish daily MACD crossover. Every meaningful IREN rally over the past year has coincided with one.
- The MACD lines remain widely separated, so what could force them to converge? A major catalyst and a significant price move.
Hmm…
- The Horizon 1 delivery reaction described in my previous post could become that catalyst.
- ChatGPT previously calculated that the most probable clean-acceptance close for Horizon 1—with partial short covering—would be approximately $39–$44.
- I also fed the IREN chart into ChatGPT and asked what closing-price path scenarios could produce a daily MACD crossover:
1. One close around $45.37: crossover during the next session
2 .Two closes around $42: crossover during the second session
3. Three Closes around $36 to $40: crossover during the third session
4. Five Closes around $36: crossover in approximately five sessions
5. Seven closes around 33.62
- Interestingly, the roughly $45 move required for an immediate MACD crossover is very close to the $39–$44 clean-acceptance range calculated for Horizon 1 delivery previously. Coincidence? We’ll see.
5. RSI vastly Oversold
- IREN has become significantly oversold.
- The weekly RSI is approximately 41, matching the level reached near the March 30, 2026 lows.
- The daily RSI is approximately 25, even lower than the readings recorded near lows of:
March 30, 2026 / December 16, 2025 / March 25, 2025
Lets see what Monday brings...