A visual guide to William O’Neil’s winning investment framework 🔖
• Align with the market trend
• Buy elite growth stocks at proper breakout points
• Manage risk relentlessly
• Let a few exceptional winners drive long-term portfolio performance.
If you are getting value out of my posts, in return please like, subscribe and retweet.
Most traders think success means avoiding losses.
Wrong.
Trading is about winning big and losing small.
Risk management keeps one bad trade from destroying months of progress.
You don’t judge a trader by a winning streak, you judge him by his trade history. Discipline always leaves a footprint.
KEY TRADING ZONES & LEVELS
CRT (High / Low) – Multiple references to “CRT high” and “CRT low” indicate key reversal or reaction levels; watch for breaks above/below for momentum shifts.
RB (Zone) – “RB” and “RB zone” likely denote resistance or order-block areas where price may stall or reverse.
OLP (Line) – “OLP” and “OLP line” suggest an overlapping or pivot line used for entry/exit references.
OHP – Overhead resistance or prior high pivot; acts as a ceiling.
FVG (Zone) – Fair Value Gaps highlighted; these are imbalance areas often used as targets or retest zones.
OB – Order block noted; a potential institutional footprint for support/resistance.
Actionable Takeaways:
Monitor CRT high/low breaks for directional bias.
Use RB and OB zones as confluence for entries or profit-taking.
Watch OLP and OHP for trend continuation or reversal triggers.
FVG zones serve as high-probability retest/target areas.
🚨 I WARNED YOU. THE 2026 BUBBLE IS ABOUT TO POP!!!
Look at the chart. Two red circles. Two bubbles. 2006 and 2026 - both landing on the exact same marker: a "Good Times, High Prices, time to sell" year on a cycle map drawn 150 years ago.
Here's why that should stop you cold.
The last time this signal pointed here, it was 2006. Prices had blown past every historical ceiling into a record bubble. Everyone "knew" it only went up. The cycle said sell. Almost nobody did.
You know what came next. 2008. It didn't just correct it took the banks, the credit system, and the entire stock market down with it. The S&P lost more than half its value. It wasn't a housing problem. It was an everything problem.
Now look at 2026. Same B-year. Same "sell" signal. But a bigger bubble.
Inflation-adjusted prices today are sitting above the 2006 peak - the literal top that caused the last crisis. Except this time it's not just one market. Stocks are at record highs. Valuations are at dot-com extremes. Credit is stretched. The whole system is inflated at once, all resting on the same tightening liquidity.
2006 was a warning that took two years to detonate. That's the danger of slow bubbles - they look calm right up until they're not.
And here's the part most people are missing: this one isn't waiting.
It's already cracking. This week alone - Korea down 10% in a single day, a global tech rout, the S&P sliding straight off its record high. The unwind everyone assumed was years away is printing on the screen right now.
You don't have to believe a 19th-century cycle secretly runs the market. You just have to notice that the same marker which nailed the 2006 top is flashing again and this time, reality already started agreeing with it.
The bubble doesn't ask permission before it pops. It just pops. And it's started.
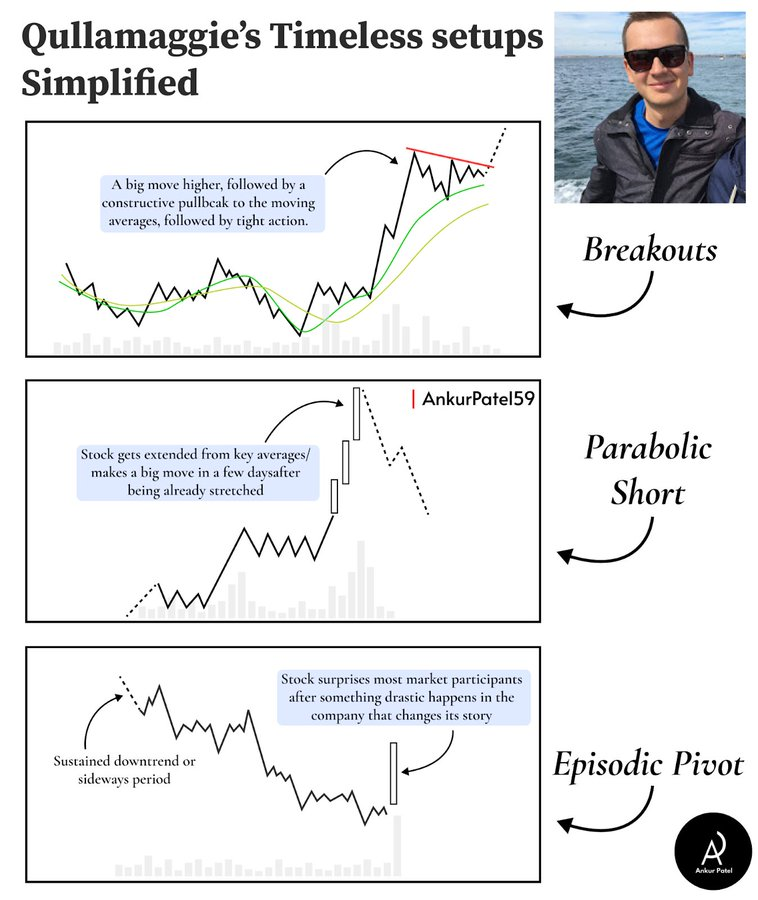
Qullamaggie's 3 Timeless Setups Simplified
Kristjan Qullamaggie has made tens of millions trading 3 simple setups. These setups occurred last year, 10 years ago, 50 years ago, and 100+ years ago. They occur over and over again.
1. Breakouts
Big move higher in the past 1-3 months. Orderly pullback with higher lows. Range expansion out of that consolidation.
How to trade it:
Enter on opening range highs when the stock breaks out
Stop at lows of the day (not wider than ATR/ADR)
Sell 1/3 to 1/2 after 3-5 days, move stop to breakeven
Trail the rest with 10-day or 20-day moving average
In bullish markets, these can give you 10-20x+ your initial risk if you're good at setup selection.
2. Parabolic Short (or Long)
Stocks are like rubber bands. When they get stretched short-term, they snap back hard.
How to trade it:
Stock up 50-100%+ in days/weeks (larger cap) or 300-1000%+ (smaller cap)
Up 3-5+ days in a row
Short on opening range lows or wait for first crack and fail at VWAP
Target is 10-day and 20-day moving averages
5-10x risk/reward, but higher win rate than other setups
3. Episodic Pivot (EP)
When unexpected good news hits a neglected stock, it can trigger multi-month or multi-year moves. Usually earnings or guidance that surprises the market.
How to trade it:
Big move (or gap up) in price 10%+
Big volume (preferably average daily volume traded in first 15-30 minutes)
Big growth numbers with significant beat to analyst expectations
Best if the stock hasn't rallied in the past 3-6 months
Enter on opening range highs. Stop at lows of the day. Trail with 10-day or 20-day moving average.
All of these setups are about finding low-risk entries on fast-moving stocks. Tight, high-probability areas to enter. High risk/reward on trades. You can be profitable with just a 25-30% win rate if you have small losses and big winners. Qullamaggie built an Evernote database over 7-8 years tracking thousands of these setups. He went back decades on thousands of stocks to find recurring patterns.
#Trading
These 6 stocks under $10B market cap are going to create millionaires:
$ONDS - a $25 stock trading at $9
$EOSE - a $25 stock trading at $11
$OSS - a $20 stock trading at $9
$TE - a $20 stock trading at $6
$LTRX - a $15 stock trading at $6
$IBRX - a $12 stock trading at $7
Save this post for later.
Note: This is not financial advice.
If you’re under 50 years old,
You have to pay attention.
The next 6-12 months are the most important of your life.
Why?
Stocks will have a crazy rally and a blow-off top.
The crypto market will begin a terrifying rally right before the largest recession in history.
The next 6 to 12 months will create a record number of MILLIONAIRES.
DON’T WASTE TIME.
This kind of opportunity is extremely rare.
If you’re reading this now, you’re not late.
There is still time,
but it’s running out fast.
I track sentiment, not prices.
That’s how I was able to buy every bottom and sell every top of the last decade.
When I fully exit the market, I’ll say it here publicly.
A lot of people will regret not following me.
✅ THE FIRST 15 MINUTES TELL YOU WHERE TO TRADE 📌
Here’s a clean, simple intraday strategy for NIFTY, BANKNIFTY, and liquid stocks.
STEP 1 — MARK THE RANGE
Wait for the first 15-minute candle to close.
Draw a line at its HIGH and another at its LOW.
Now you have your morning range.
STEP 2 — DO NOTHING… YET
No trades inside the range. Just wait.
STEP 3 — TRADE THE BREAKOUT
· Price breaks ABOVE the 15-min high and closes → look for BUY.
· Price breaks BELOW the 15-min low and closes → look for SELL.
EXAMPLE SELL SETUP;
· Entry: Below the first 15-min low.
· Stop loss: Above the first 15-min high.
· Target: Nearest support level
RULES TO RESPECT;
· Trade only after the first candle closes.
· Avoid choppy sideways markets.
· Use volume or RSI to filter fake breakouts.
✍️ Let the market show its hand, then follow.