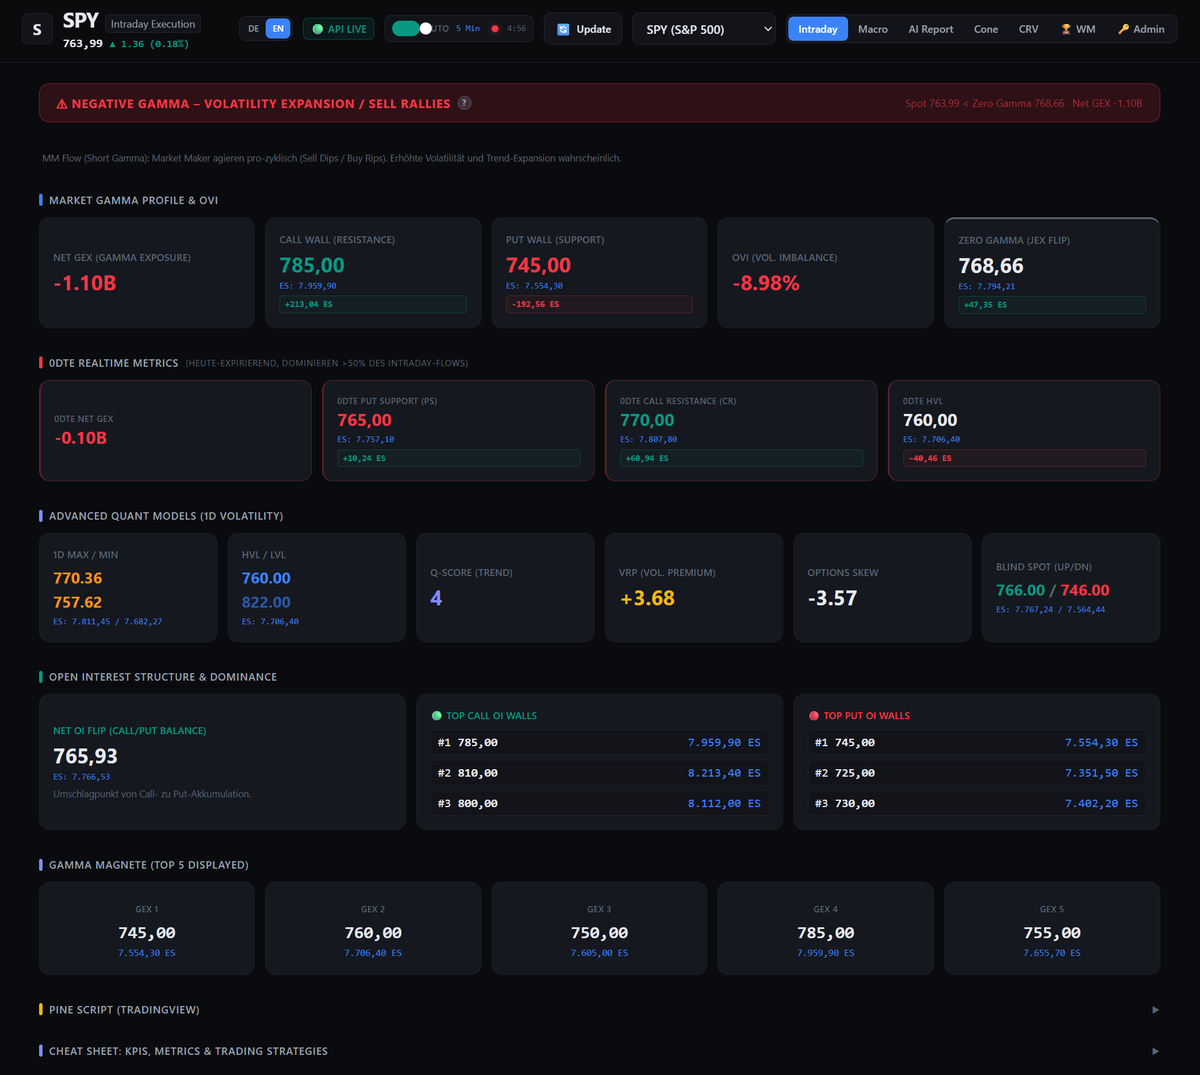
⚠️ $SPY / $ES_F: Deep in Negative Gamma — Expansion Mode
The dashboard shows an intensification in dealer short gamma positioning:
📊 Regime & Quant Mechanics:
• Regime: Negative Gamma — Volatility Expansion / Sell Rallies
• Spot: 763.99 SPY < Zero Gamma: 768.66 (7,794.21 ES)
• Net GEX: -$1.10B (Dealers pro-cyclical: selling dips, buying rips)
• 0DTE Net GEX: -$0.10B (Intraday and macro flow both negative)
• OVI: -8.98% | VRP: +3.68 | Skew: -3.57
🎯 Critical Execution Levels mapped to $ES_F:
• Zero Gamma Pivot: 768.66 SPY ≈ 7,794.21 ES (Key macro hurdle)
• 0DTE Call Resistance: 770.00 SPY ≈ 7,807.80 ES
• 0DTE Put Support: 765.00 SPY ≈ 7,757.10 ES
• 0DTE HVL / GEX 2 Magnet: 760.00 SPY ≈ 7,706.40 ES
• Put Wall / GEX 1: 745.00 SPY ≈ 7,554.30 ES
• Blind Spot Zone: 766.00 / 746.00 (7,767.24 – 7,564.44 ES)
Price is trading well below Zero Gamma, keeping dealers in hedging drag where bounces are prone to aggressive fades. Watch 7,757 ES as immediate support; breaking it opens a fast vacuum run down to the 7,706 ES HVL magnet.
Let the options architecture define your roadmap—let footprint and order flow trigger the trade.
🔗 Dashboard access & auto-updating indicators in 1st reply.
$NQ_F #GEX #OrderFlow #VolTwit #GammaExposure
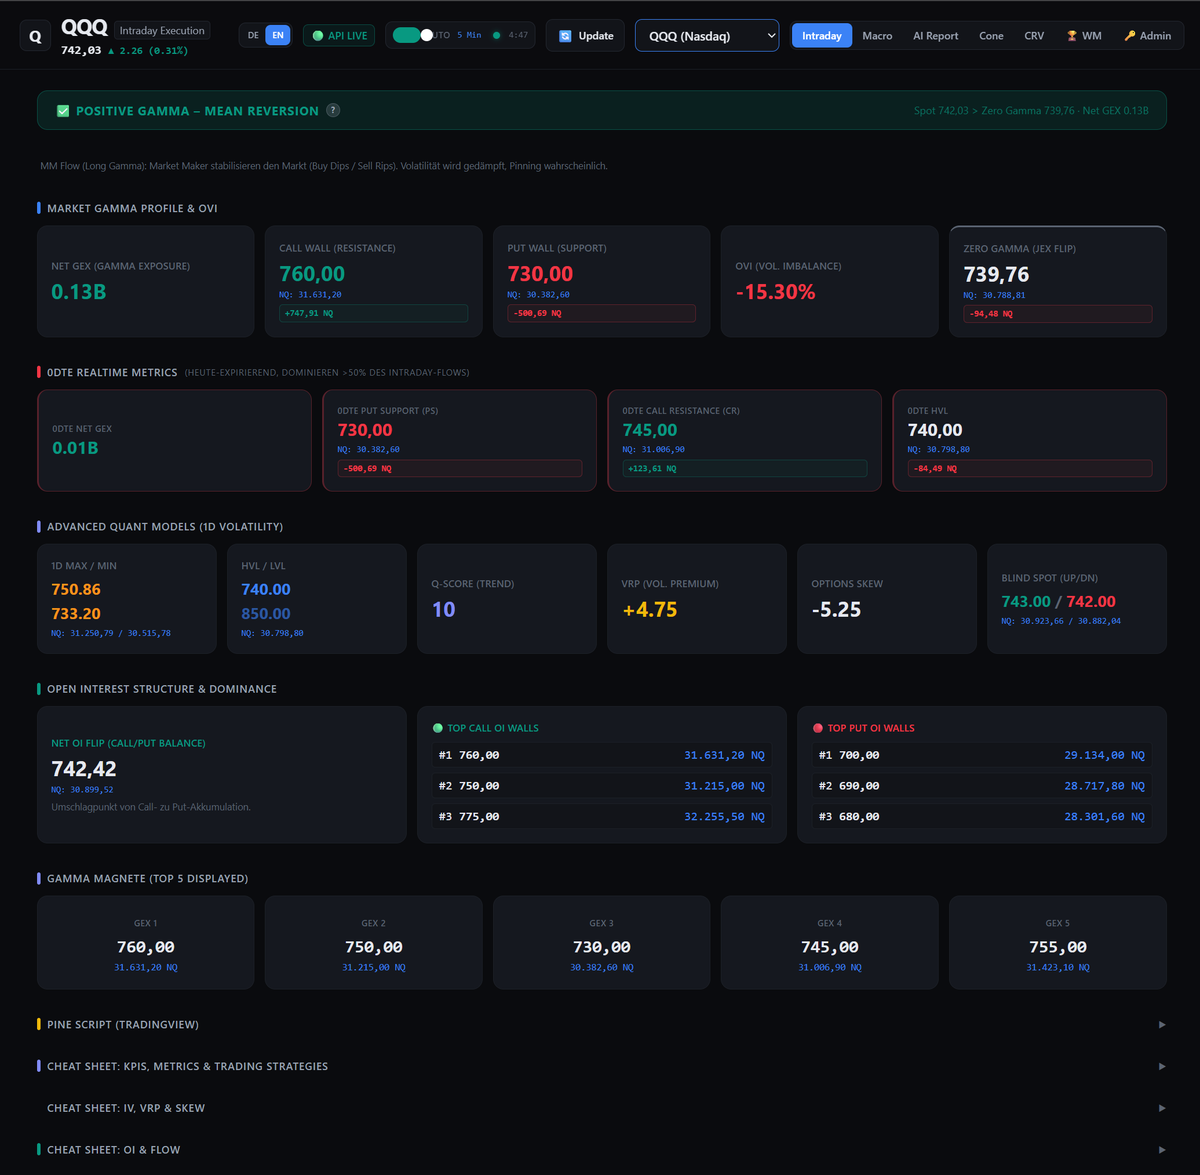
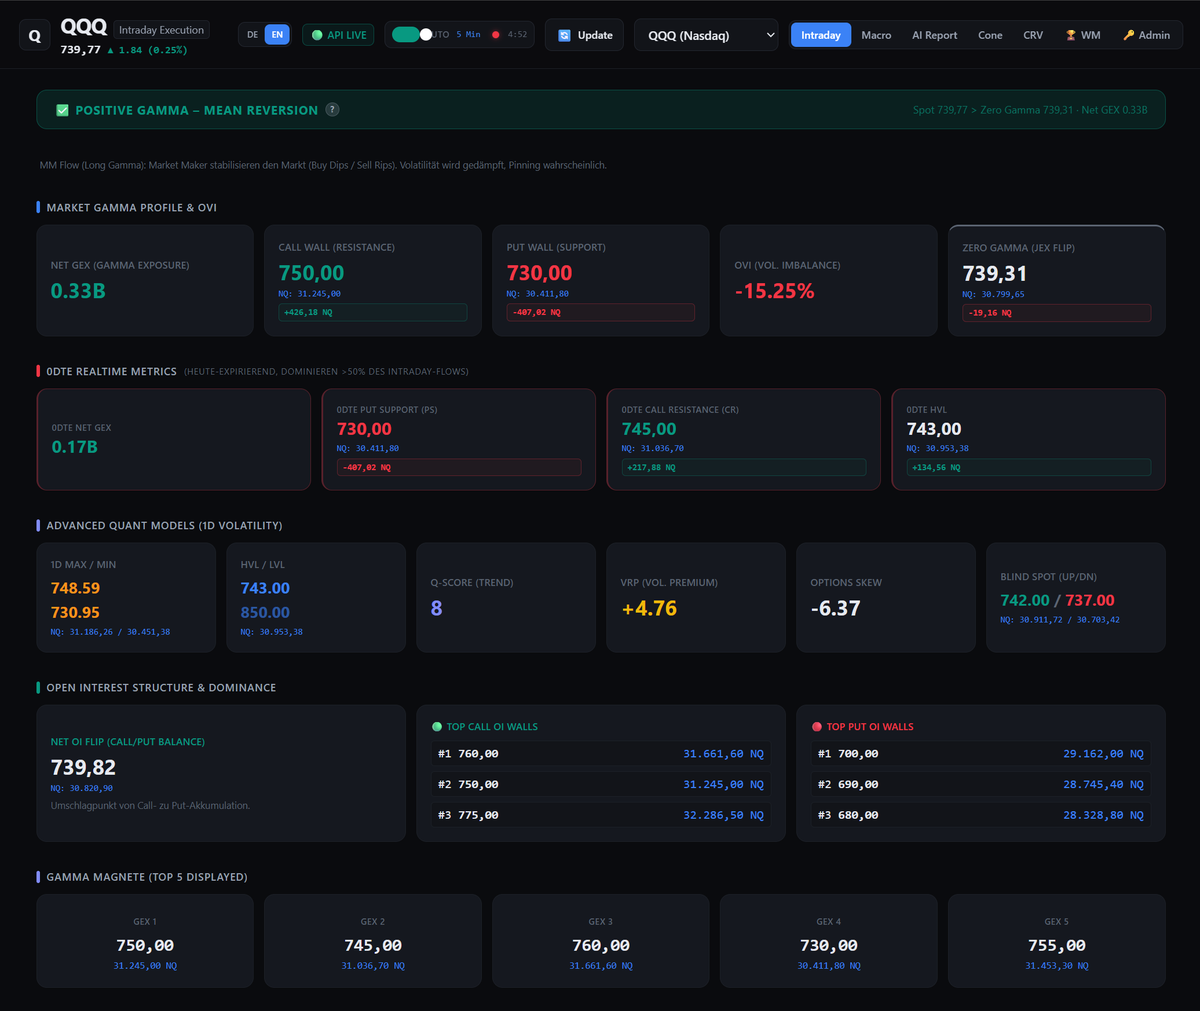
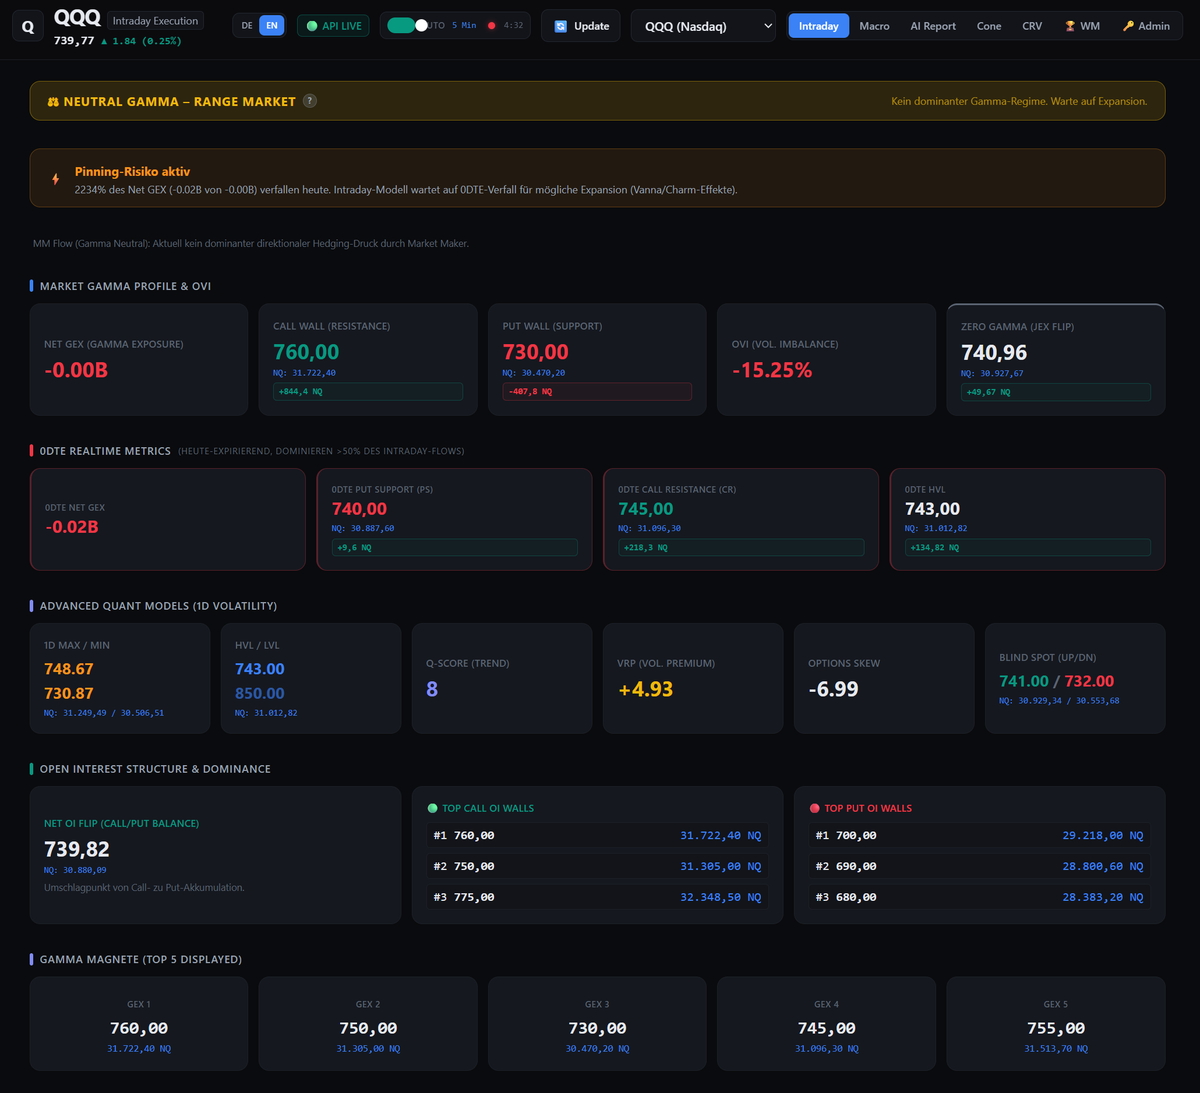
⚡ $QQQ / $NQ_F Intraday Update: Maximum Compression & Pinning Risk
The latest dashboard snapshot just flipped into an extreme compression setup:
📊 Regime & Positioning Check:• Regime: Neutral Gamma — Range Market (No dominant directional dealer pressure)
• Net GEX: -0.00B | 0DTE Net GEX: -0.02B
• Pinning Alert Active: Massive chunk of today’s gamma is set to expire into the close — volatility stays suppressed until 0DTE decay unlocks expansion (Vanna/Charm unwind).
• VRP: +4.93 | OVI: -15.25% | Skew: -6.99 (Put protection bid)
🎯 Key Intraday Reference Levels:
• Zero Gamma Pivot: 740.96 QQQ ≈ 30,927.67 NQ
• 0DTE Put Floor: 740.00 QQQ ≈ 30,887.60 NQ
• 0DTE Call Ceiling: 745.00 QQQ ≈ 31,096.30 NQ
• 0DTE HVL: 743.00 QQQ ≈ 31,012.82 NQ
• Net OI Flip: 739.82 QQQ ≈ 30,880.09 NQ
Price is tightly coiled right between the 0DTE Put Support (30,887 NQ) and the Zero Gamma line (30,927 NQ).
Don't force directional breakout trades in the middle of a pinned, neutral gamma corridor. Wait for price to test the boundaries, then let order flow confirm either absorption or expansion.
🔗 Dashboard access & auto-updating indicators in 1st reply.
$QQQ $NQ_F ESFSPX #GEX #OrderFlow #VolTwit #GammaExposure
First Reply (Direkt als erste Antwort unter deinen Post)
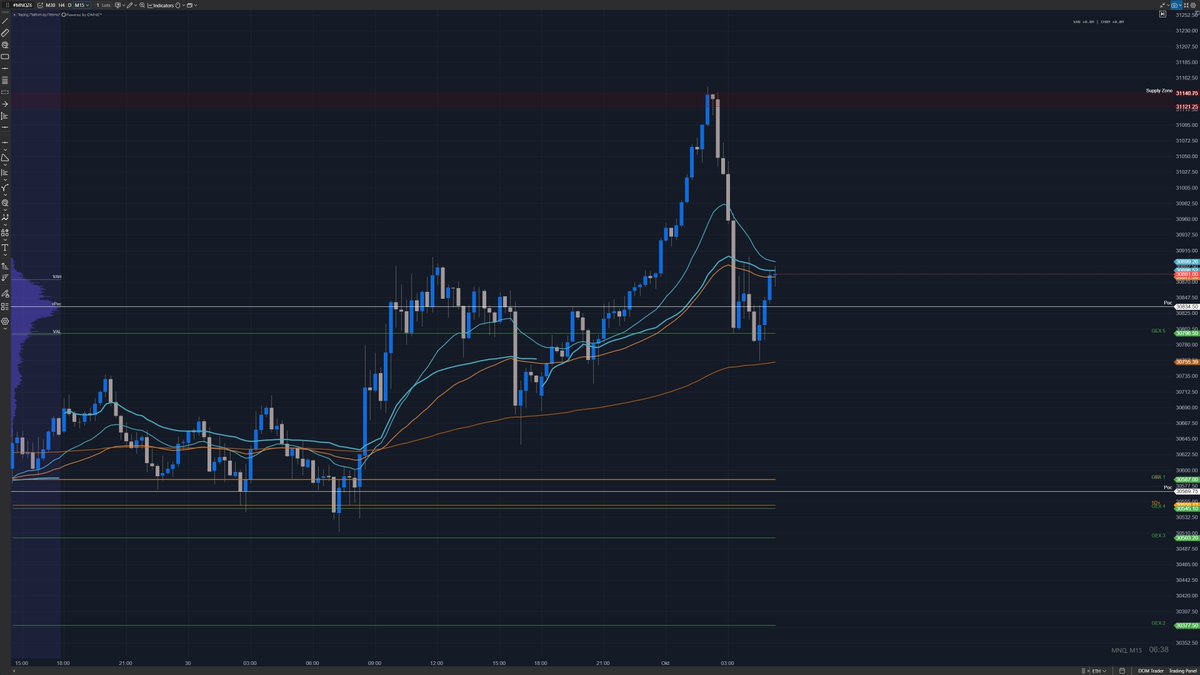
🎯 When the options roadmap delivers textbook execution.
Earlier, the dashboard flagged a Positive Gamma / Mean-Reversion regime on QQQ/QQQ / QQQ/NQ_F.
The strategy was simple: do not chase the vertical impulse into the highs. Instead, target the pre-calculated GEX 5 structural level at 30,796.50, which aligned directly with the underlying Value Area and Volume Profile support.
The result:
Price rejected the extreme supply zone above 31,120 and rotated all the way back down into the exact GEX 5 line at 30,796.50—delivering a clean, high-probability 300+ point mean-reversion drop straight into the target zone.
No guessing. No emotional trading.
1️⃣ Macro Gamma Dashboard sets the regime & target magnet.
2️⃣ Auto-updating indicator plots the levels directly into the chart.
3️⃣ Order flow & price action confirm the exit/take-profit.
Trade context, not noise.
🔗 Dashboard access & auto-updating chart indicators in 1st reply.
$NQ $NQ_F NQFQQQ ESFES_F ESFSPX #GEX #OrderFlow #VolTwit #GammaExposure
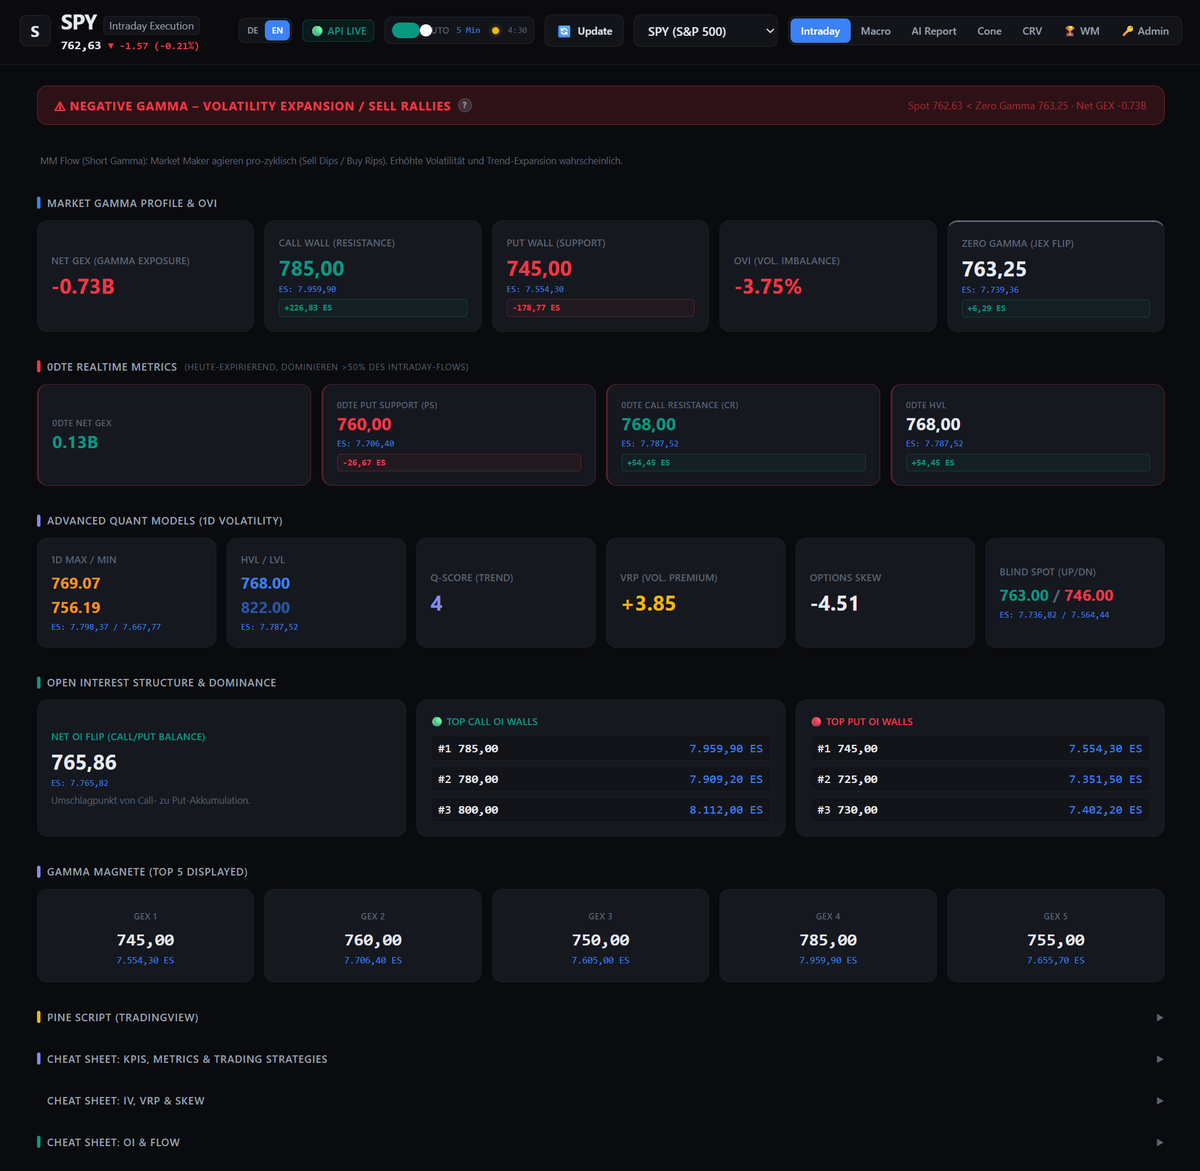
⚠️ $SPY $ES_F: Negative Gamma into the session
My dashboard shows Negative Gamma — Volatility Expansion / Sell Rallies. SPY is at 762.63, below Zero Gamma at 765.96, with Net GEX at -$1.29B.
Key ES levels mapped by the dashboard:🔻 7,777.52 — 0DTE Put Support
⚡ 7,797.47 — Zero Gamma
🔼 7,808.06 — 0DTE Call Resistance
🧲 7,818.24 — 0DTE HVL
🧱 7,991.30 — Call Wall
🛡️ 7,584.10 — Put Wall
0DTE Net GEX is -$0.06B. I’m watching how price reacts around the nearby gamma levels rather than assuming a direction. The dashboard also puts the 1D range, OVI, VRP, skew and open-interest structure in one view—useful context for planning risk and identifying areas to watch.
The ATAS and TradingView indicators bring the mapped levels onto the chart, where I can assess them alongside price action and order flow.
Options context on the dashboard. Levels on the chart. Confirmation from the tape.
$SPY $ES_F #GEX #OrderFlow
Dashboard link and indicator details in the first reply.
First reply: Explore the GEX Dashboard, ATAS indicator and TradingView integration:
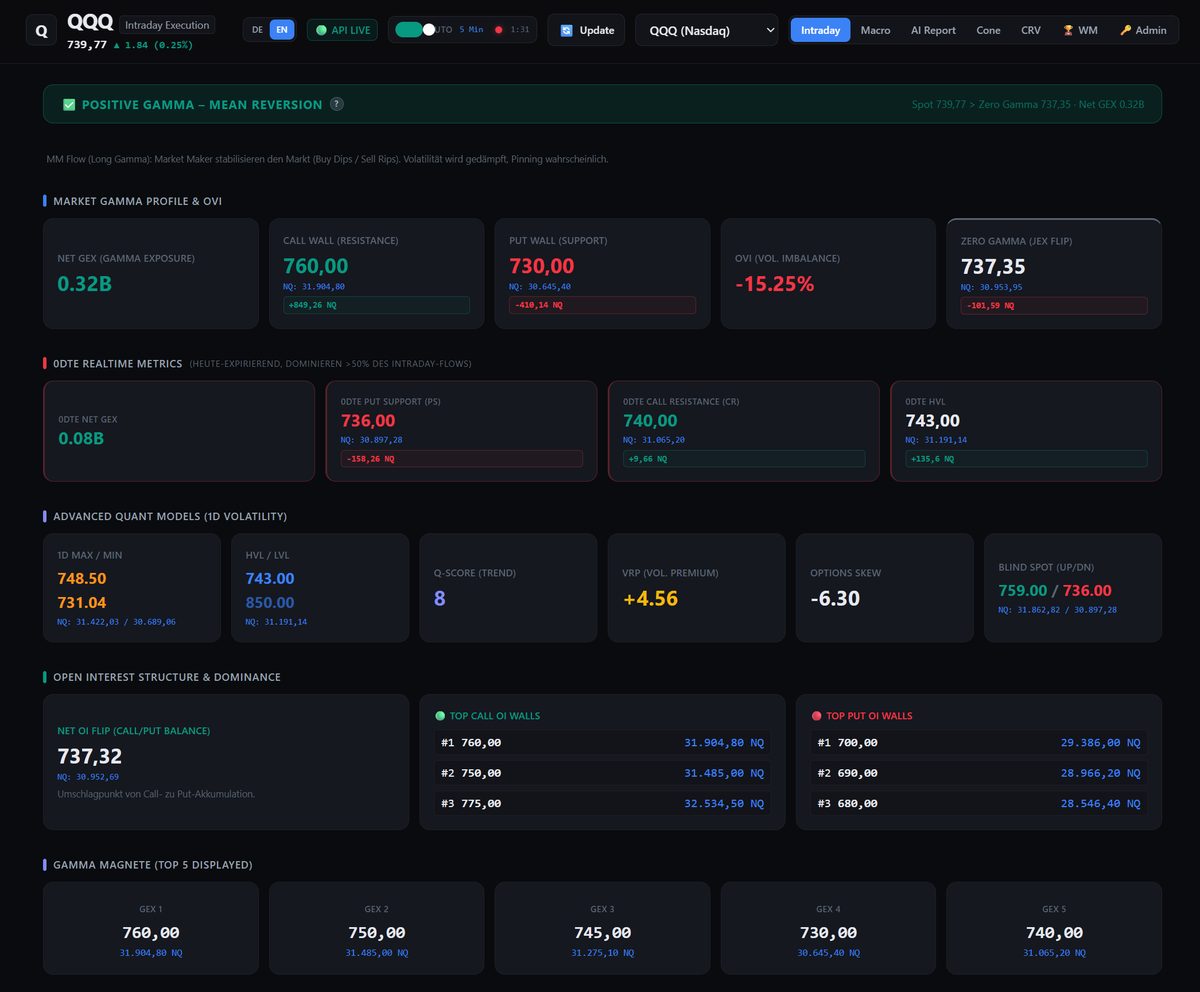
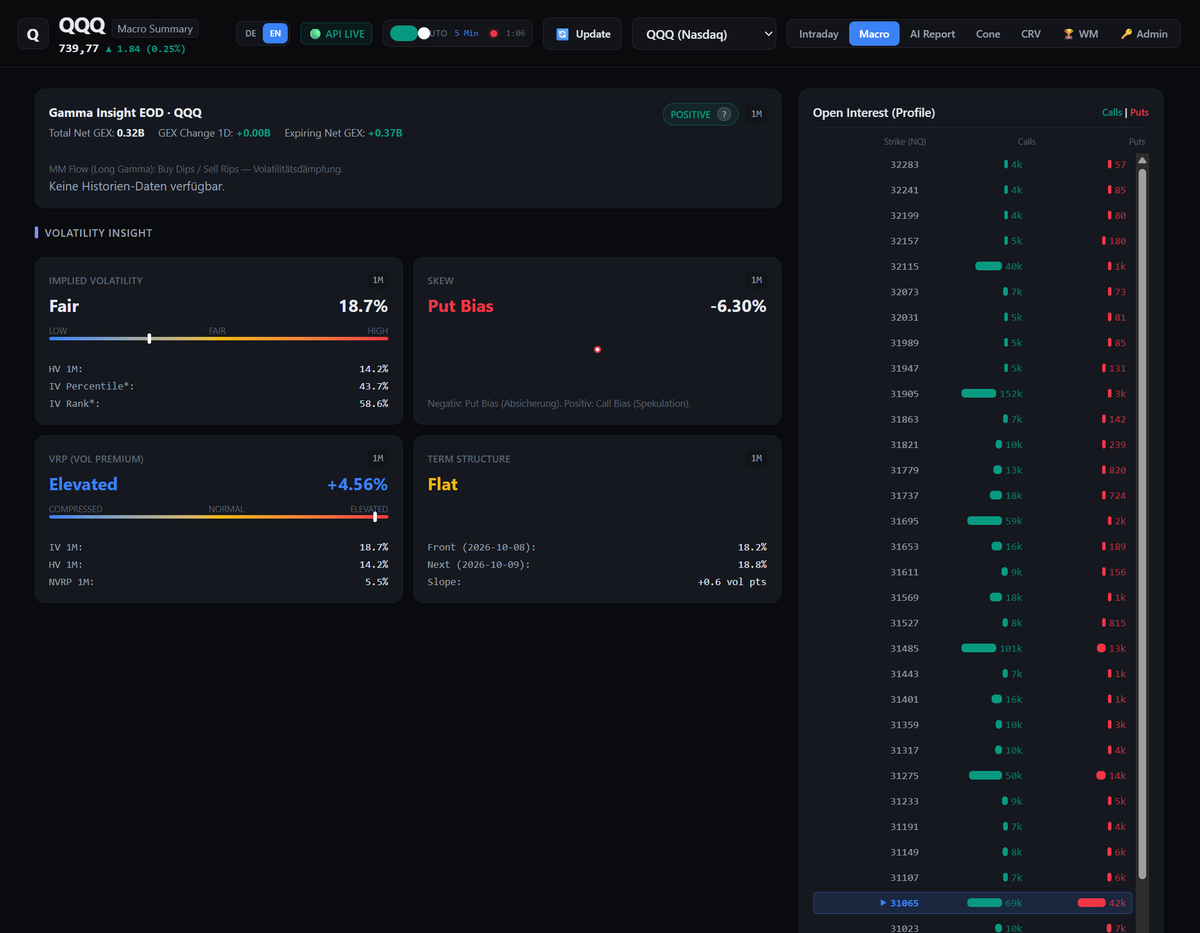
⚡ $NQ_F Gamma Map: Positive Gamma, Mean Reversion
The dashboard shows +$0.32B Net GEX and +$0.08B 0DTE GEX. QQQ is at 739.77, above Zero Gamma at 737.35—a positive-gamma setup where mean reversion may matter more than chasing moves.
Key NQ reference levels:🔻 30,897 — 0DTE Put Support
⚡ 30,953 — Zero Gamma / OI Flip
🔼 31,065 — 0DTE Call Resistance
🧲 31,191 — HVL
🧱 31,905 — Call Wall
The dashboard also puts OVI (-15.25%), VRP (+4.56), skew, blind spots and the 1D volatility range in the same view—useful context for both futures execution and options positioning.
Then the ATAS and TradingView indicators bring the mapped levels onto the chart. No manual plotting; just a clearer framework for watching price reaction and checking for order-flow confirmation. The screenshot shows the gamma map, not a verified POC confluence—so I’m not claiming one.
Dashboard link in the first reply.
$QQQ $NQ_F ESFSPX #GEX #OrderFlow
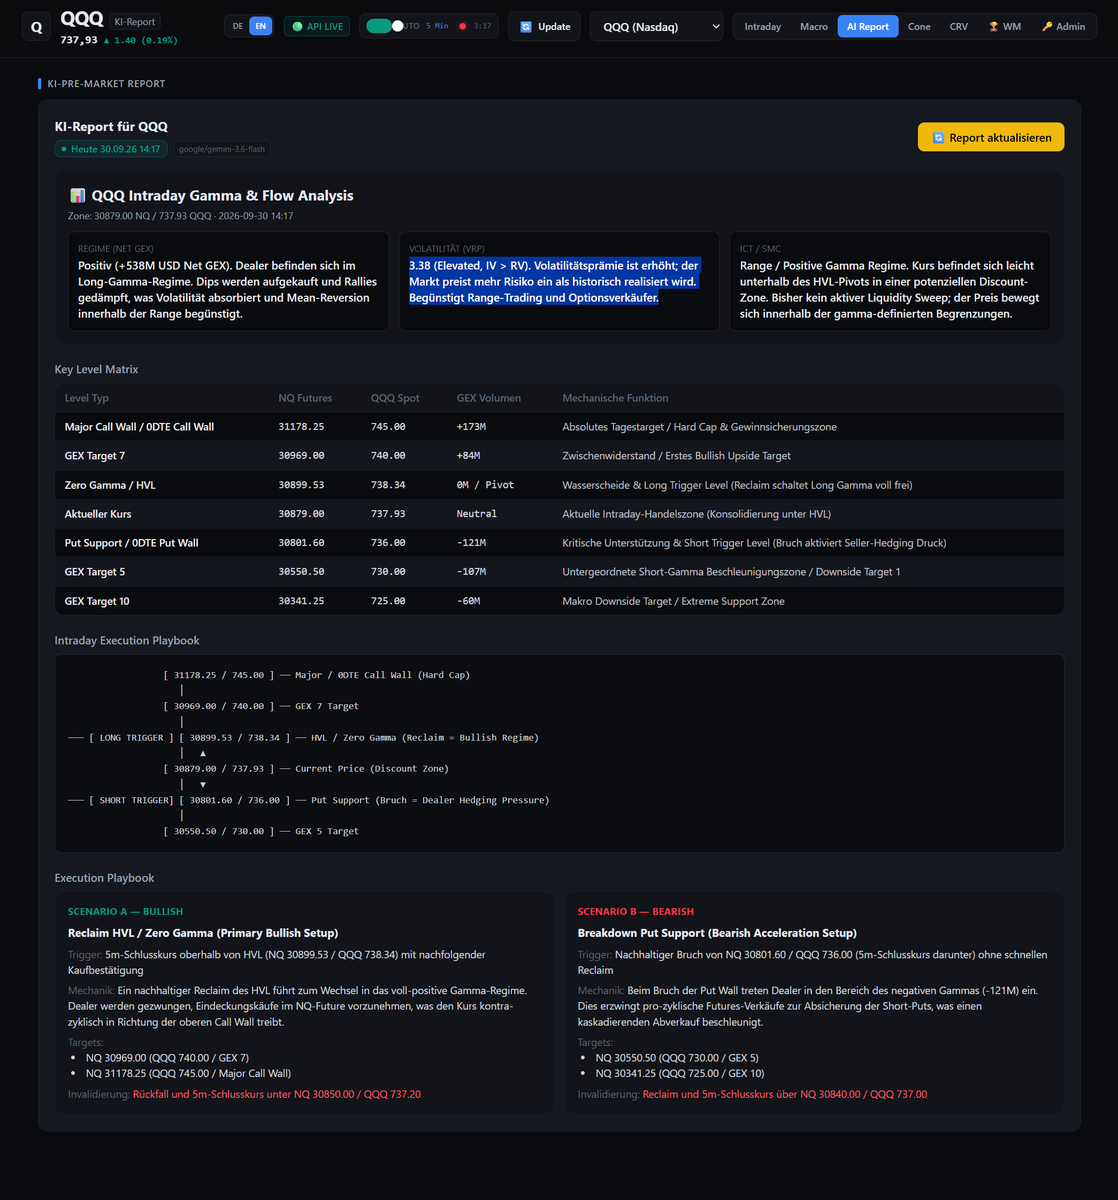
⚡ $QQQ / $NQ_F: AI-Generated Pre-Market Playbook
My AI Report just flagged the current regime: Positive Net GEX (+$538M). Dealers are long gamma — dips get bought, rallies get capped, and volatility gets absorbed. VRP is elevated at 3.38 (IV > RV), favoring range-trading and premium sellers.
Key Level Matrix (NQ / QQQ):
🧱 31,178.25 / 745.00 — Major Call Wall (hard cap)
🎯 30,969.00 / 740.00 — GEX 7 target
⚡ 30,899.53 / 738.34 — Zero Gamma / HVL (long trigger)
📍 30,879.00 / 737.93 — Current price (discount zone)
🛡️ 30,801.60 / 736.00 — Put Support (short trigger)
🎯 30,550.50 / 730.00 — GEX 5 target
⚠️ 30,341.25 / 725.00 — GEX 10 / macro downside
Playbook:
🟢 Bullish: 5m close above 30,899.53 → targets 30,969 → 31,178
🔴 Bearish: 5m close below 30,801.60 → targets 30,550 → 30,341
Price is currently coiled between the two trigger levels, right in the discount zone below HVL. No forced bias until one side confirms.
This isn't a manual read — it's an AI-generated synthesis of GEX, VRP and ICT/SMC structure, updated every 5 minutes.
🔗 Dashboard & AI Report access in 1st reply.
$QQQ $NQ_F #GEX #VolTwit
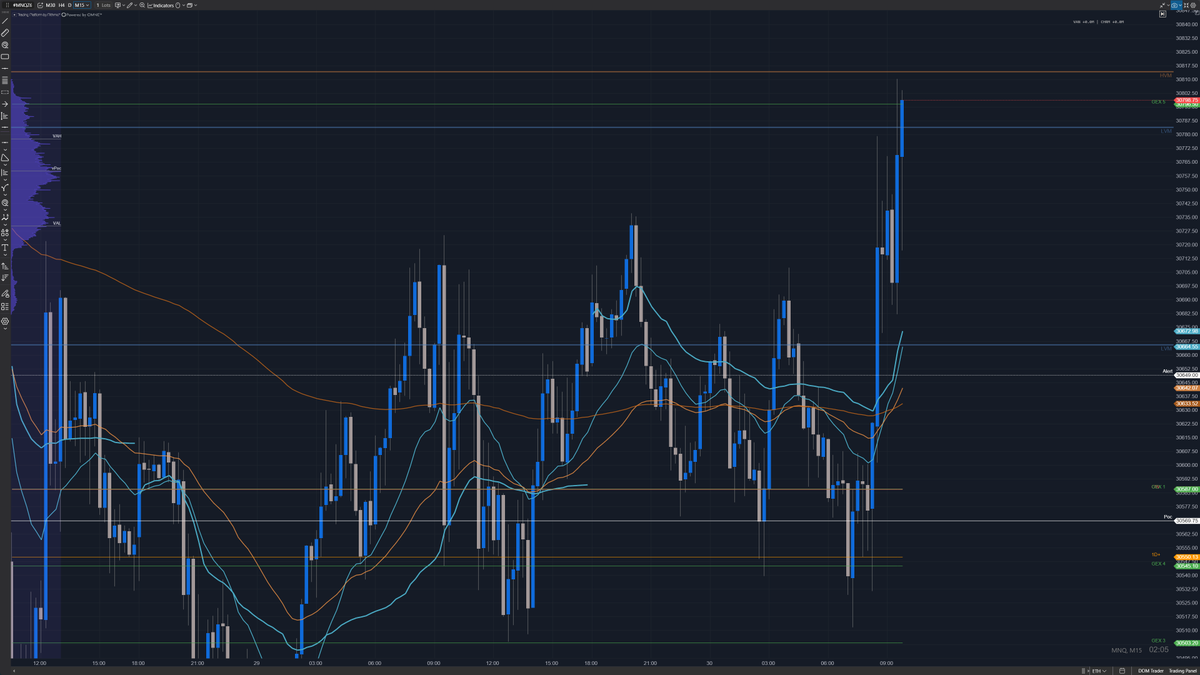
⚡ $NQ_F Gamma Levels in Action
Live on the chart: price broke out of the range and ran straight into the mapped GEX cluster at 30,798.75, right under the HVM resistance at ~30,810.
Before the move, price had been basing for hours right on top of the GEX4/POC support zone around 30,545–30,570—exactly where the gamma map flagged dealer positioning as a floor.
This is the confluence I look for:
🔻 30,545–30,570 — GEX support / POC, held for hours before the push
🔼 30,798.75 — GEX resistance, now being tested live
🎯 30,810 — HVM / next decision zone if this level breaks
Gamma levels aren't drawn freehand—they're calculated from real options positioning and plotted directly onto the chart via my ATAS indicator, so the reaction can be read live against volume and order flow.
Structure first. Confirmation from the tape.
🔗 Dashboard & ATAS indicator setup in 1st reply.
NQFQQQ #GEX #OrderFlow