Comparing $BTC to $GLD creates an illusion that bitcoin is digital gold (when in reality it's not). If anything, bitcoin is digital money.
Gold is the worst deflator when compared to M2, $NDX, and $SPX.
Using gold as a reference also destroys bitcoin's relationship to the 4-year economic cycle, which has been in play for many decades.
USD is still the best denominator.
Does $MSTR have a tendency of topping and bottoming before bitcoin:native? Very few data points, but is it possible that leveraged investors feel the heat and spot the opportunity before the beast turns?
* Topped 39-46 weeks (9-11 months) before bitcoin (2 data points: 2021, 2024-25)
* Bottomed 26 weeks (6 months) before bitcoin (1 data point: 2022)
If Strategy bottomed this week, bitcoin is expected to follow in December (+/- 2 months).
This relationship could turn out to be spurious since the respective moving averages appear to move in sync. Time will tell (but for this we need Strategy to survive!).
The idea below of fixed duration between hitting the previous all-time high and the cyclic trough is intriguing but doesn't bear out in reality:
* 2013-2015: 97 weeks
* 2017-2018: 93 weeks
* 2020-2022: 101 weeks
The average is 97 weeks = ~22.3 months. This would put the cyclic trough in Jan'26, which is obviously nonsense. One cannot count on these specific levels being reached at the same time each cycle.
Why is bitcoin in a bear phase? Explain it like I'm 4 (no cycles).
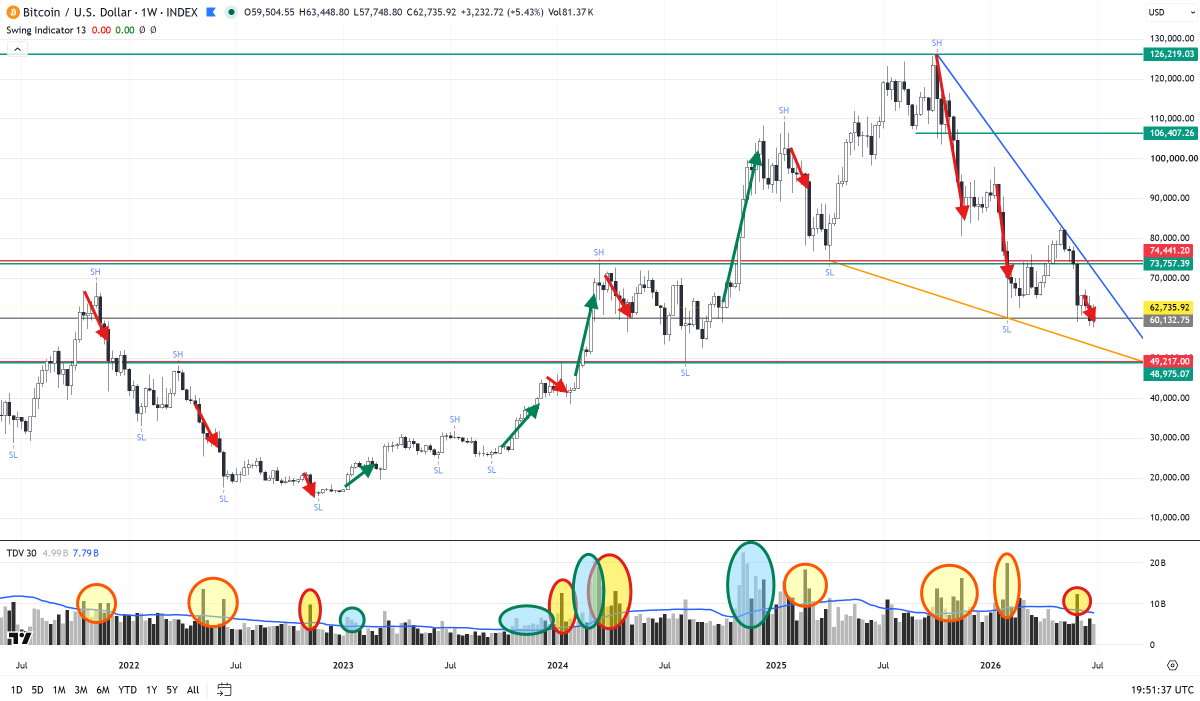
Top pane: $BTC weekly price
Bottom pane: Total USD volume
All volume peaks align with price action. All rallies without volume support (either way) eventually fail.
Nov'21 - Nov'22 bear: Only downside support.
Nov'22 - Oct'25 bull: Mostly upside, but serious challenges Jan-Apr'24 & Mar'25, fails Oct'25.
Oct'25 - now: Only downside support (price only rises on low volume).
This is why we are still in the claws of the bear, little one.
Silver has finally retested the $55 level -- this was the level that launched the move to $120.
This is a possible level for the start of a bottoming phase, yet price could dip into the low 40s first. The 40s is just a discussion level, not a price target. $SI_F
#Solana (#SOL) 🇺🇸 Monitoring the wave count on the weekly timeframe
Is the correction still ongoing? 🤔
The current price trend remains corrective, as evidenced by the details of the internal waves within the downtrend. The price may see a final decline through the sub-waves of Wave C within a larger-degree corrective wave—which represents Wave (2)/(B)—following the formation of an upward corrective wave via Wave B of this corrective wave and a break of a key level.
This corrective move could extend 〽️ to the first reversal support zones or even reach the second zone, as shown in the chart.👌
A breakout of a key level via an impulsive wave would give the green light to this positive scenario through wave (3)/(C).
Our Daily Premium Analysis 👉 : https://t.co/p1Y24s1hGo…
For Our Educational Program Analysis 👉 :
https://t.co/XBwdSyq4uP…
#elliottwave #tradingview #technicalanalysis #swingtrading #waveanalysis #BTCUSD #cryptocurrencies #btctrading #forexdubai #forexeurope #forexuk #ETHUSD #tradingstrategies #priceactiontrader #ethereumtrading #ethereuminvestment #ethereumprice #bitcoinsignals #priceactiontrading #forexmalaysia #forexespanol #forexfrance #tradingacademy #forexaustralia #bitcointrading #Dogecoin #SOLUSDT