we built this for the version of you that’s been burned twice.
no price calls. no referrals. no list-selling. no discord, no paid signals.
we describe behavior.
we name patterns. we admit when we were wrong.
morning brief, weekdays. link in bio.
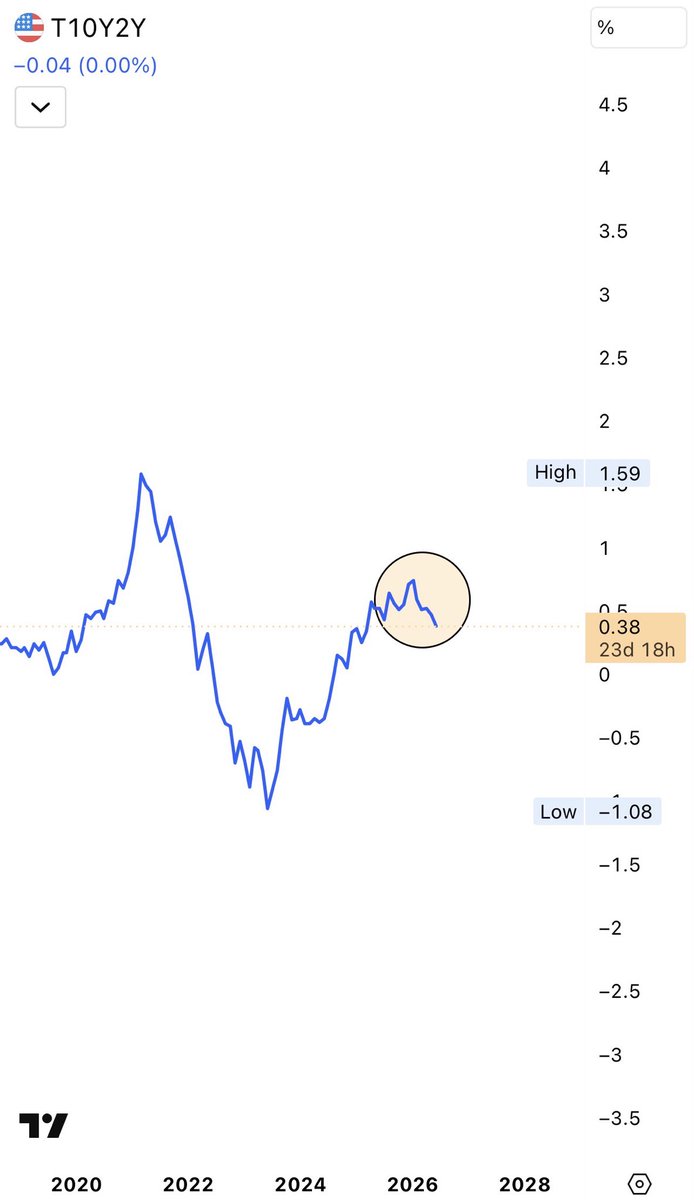
Both the 10y-2y spread (R10-R2) slope declining sharply, indicating confirmation of a ‘Speculative’ investment regime featuring high volatility and low returns in risk assets like stocks, $BTC and altcoins.
$BTC is retesting a macro support area that was once macro resistance. In technical terms, this is a normal and healthy reaction by the $BTC. So relax and stay calm, $BTC will bounce back, but before that, we will most likely go for some more lower liquidity.
8/8
Bottom line:
By gold, the bear is old & deep.
The structure means no fireworks at the low.
A soft dollar + dovish Fed handover is the historical setup for liquidity to resolve in BTC’s favor.
Stop waiting for the crash. This bottom whispers.
1/
$BTC Bitcoin is down ~39% from its October high.
But here’s what almost nobody is saying:
This is the quietest bear market in Bitcoin’s entire history.
And that one fact is being badly misread. 🧵
The part nobody prices:
BTC is now a domesticated equity proxy.
Correlation to equities: 0.75 (record).
BTC-vol vs VIX: 0.88 (record).
It got calmer AND more stock-like at once. It no longer diversifies. But a real liquidity turn would transmit UP just as mechanically.
Bulls have earnings.
Bears have valuation.
Both are right.
The tape sits in its tightest range since the 1960s. Sentiment at cycle highs. Cash at cycle lows.
The question isn’t who wins the argument.
It’s who has anything left to buy. Top is not in. Just yet. $SPX
everyone’s drawing the #wyckoff accumulation on $BTC right now.
spring at $60k. channel break. higher low. textbook.
here’s the tell: every wyckoff distribution looks like accumulation until the last candle. the $82k rejection is the same chart in both stories.
above $82k it’s markup.
below $72k it’s a trap.
between, it’s just hope wearing a schematic.
stop drawing. start watching.
“the world runs out of oil in june” trended for 11 hours. goldman’s actual number is 98 days of demand by month-end. the gap between those two sentences is where most retail oil trades go to die. #oil#economy#energy#trading
brent: $88 to $104 in 6 days, on peace-talk headlines. fed: paused with the most dissents since 1992. cpi: stuck at 3.3%. the #crypto timeline this morning calls this “the macro setup.” the macro is uncertainty. the setup is the framing. which one is being sold?
senate votes monday on warsh. june 17 is his first meeting. futures price a hold at 95%.
three months ago crypto x said warsh meant $60k. last month, $200k. the man hasn't changed. the audience has.
the fed isn't the trade this week. the audience is.
(ALTCOINS MONITOR) A lesser-known gem for retail investors: RaveDAO (RAVE), a low-cap token (~$4.4B market cap, rank ~23), exploded +6,204% over 7 days and +6,401% in 30 days, topping gainer lists with $446M volume—yet its FDV/market cap ratio of 0.25 signals massive future dilution risk (only 25% supply circulating). This “hidden supply overhang” often traps late retail buyers in pumps; watch for whale dumps as dominance stays high, turning it into a short/avoid signal rather than a moonshot.
Overall, BTC dominance at 64% amid flat prices warns of altcoin weakness despite outliers like RaveDAO’s surge, advising retail focus on BTC accumulation over chasing pumps—high FDV ratios like RAVE’s highlight dilution traps in bull traps. Monitor ETF flows and dominance for the next leg up.