These are all solid points.
Let’s take it one step further…
Think back to the 2016 to 2017 cycle.
Bitcoin took a 20% hit, two 30% hits, one 35% hit, and three separate 40% flushes. It was relentless. Yet the market still delivered a 46x move.
The human mind conveniently forgets how awful those corrections felt because the final outcome rewrote the narrative.
Now look at this cycle...
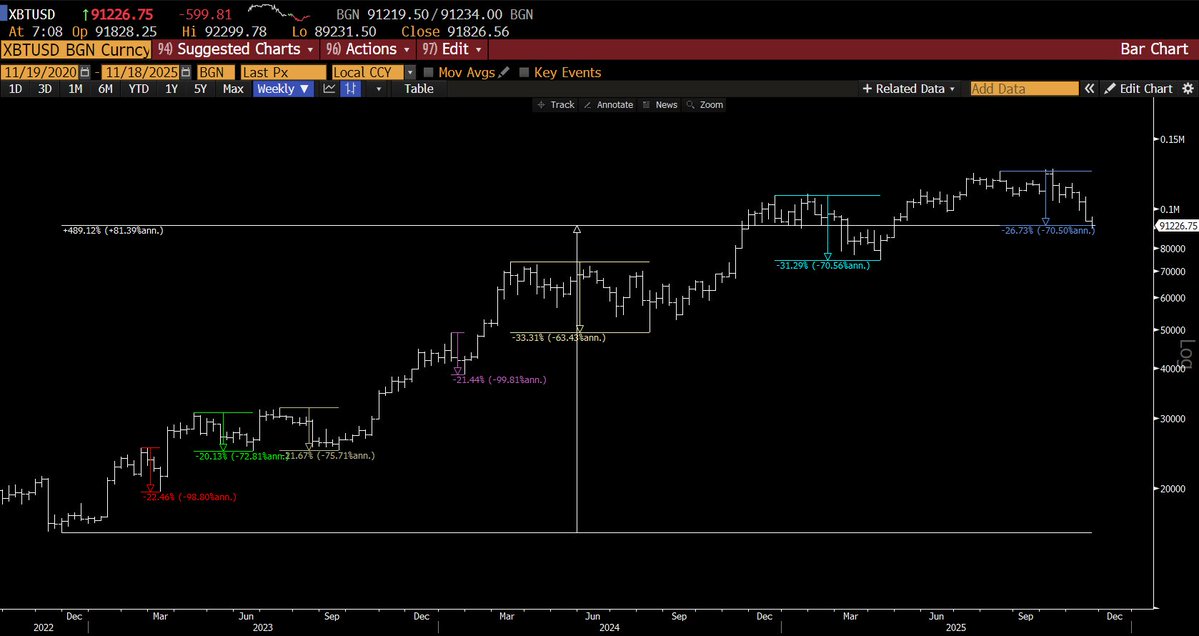
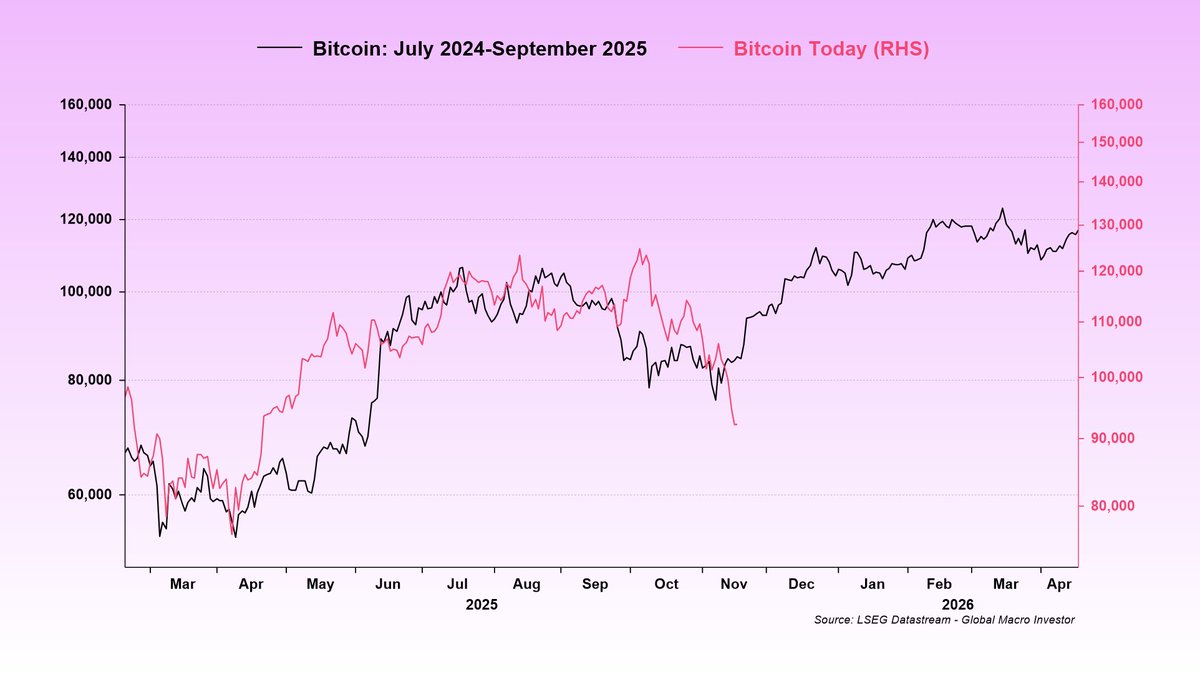
We have had four 20% pullbacks and now three 30% pullbacks (chart 1).
Nothing about this is new. It only feels painful because you are inside the move right now. And if you are anchored on the idea that the cycle peaks this year, which is not our base case but is a view many people hold, it becomes very easy to convince yourself that you missed the bulk of the move, that it’s all over, and that the best of this cycle is already behind us.
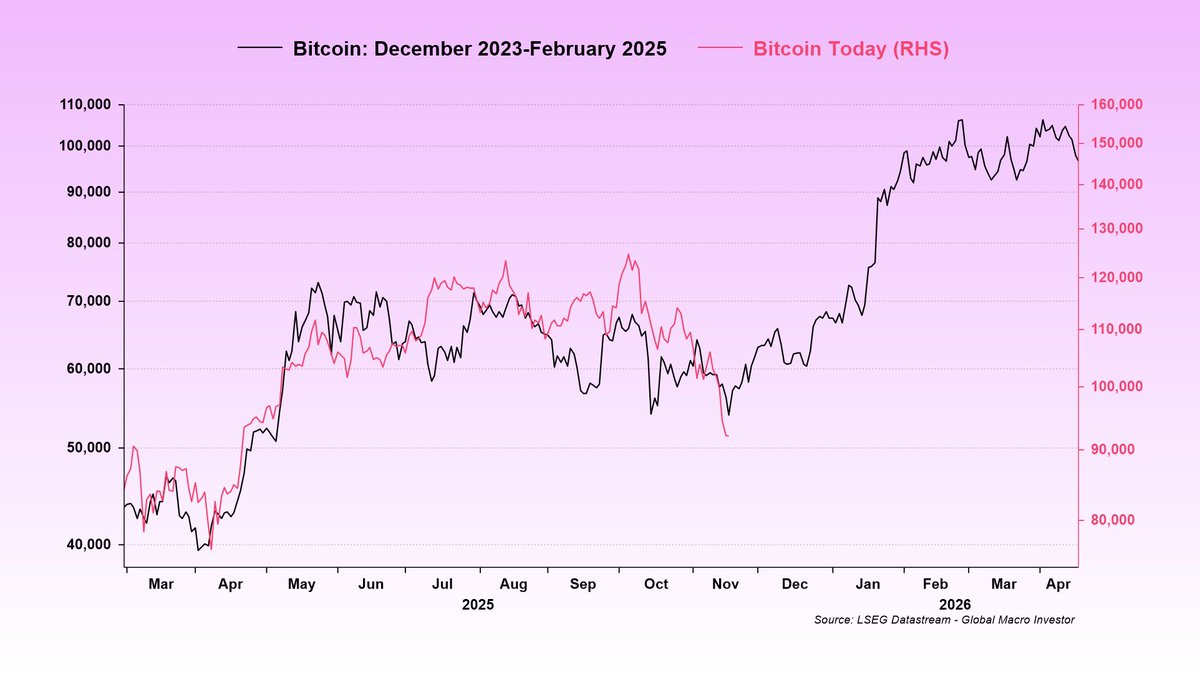
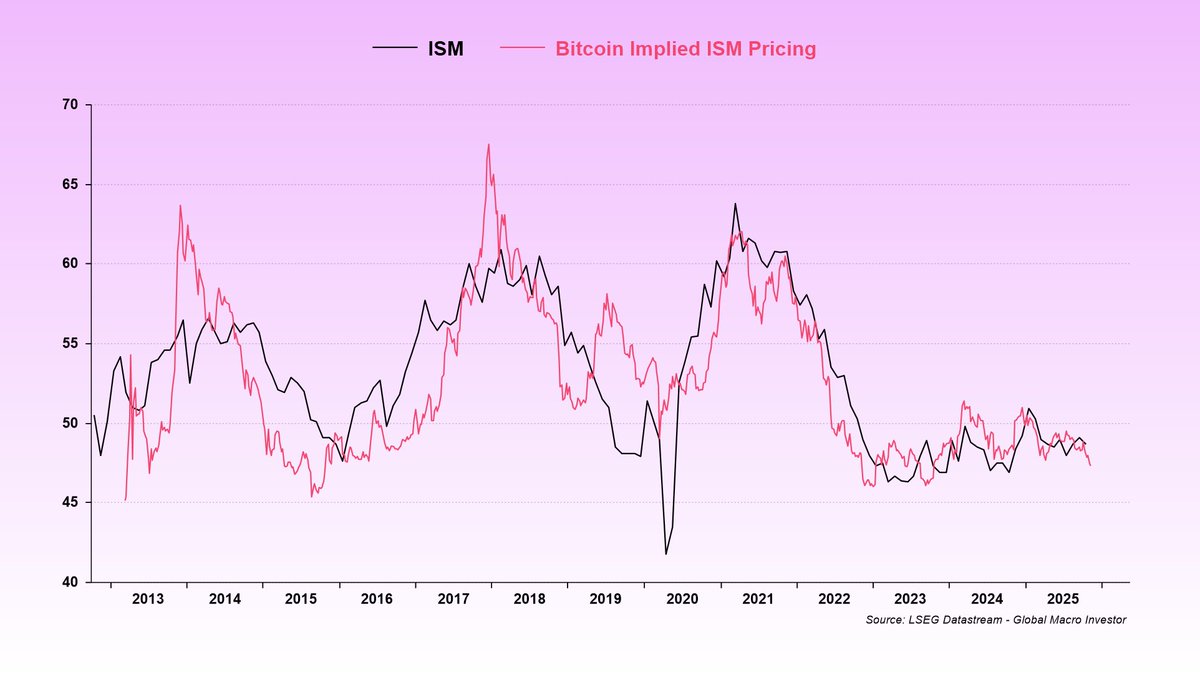
What really stands out is how similar these corrective structures have been over the past couple of years, as shown in charts 2 and 3…
The pattern, the size, the timing, they keep repeating. It is almost fractal. I have more examples of this as well.
When you compare both the magnitude of the pullback and the amount of time spent correcting, it suggests we are getting very close to the end of this move.
Now, to Raoul’s point, sentiment is indeed completely washed out…
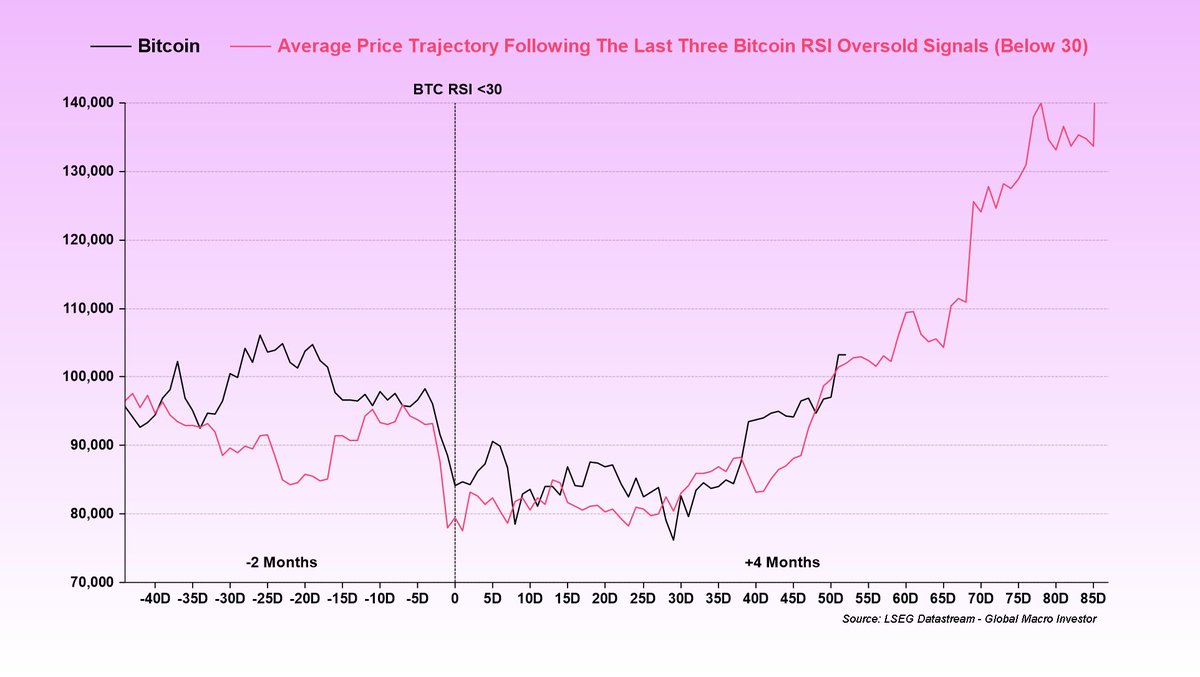
Everyone is calling for the top. People are capitulating emotionally and not analytically. That is exactly the environment where bottoms tend to form. RSI is sitting at 28, and DeMark counts are close to flashing 9s and 13s almost across the board.
Nothing is guaranteed, but the probabilities are starting to lean heavily toward a bottom forming this week. Let’s see…
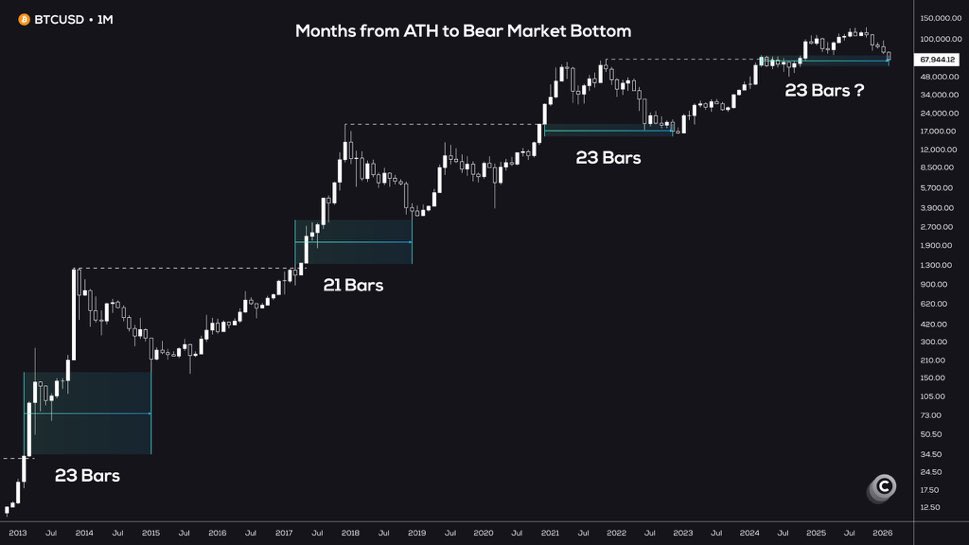
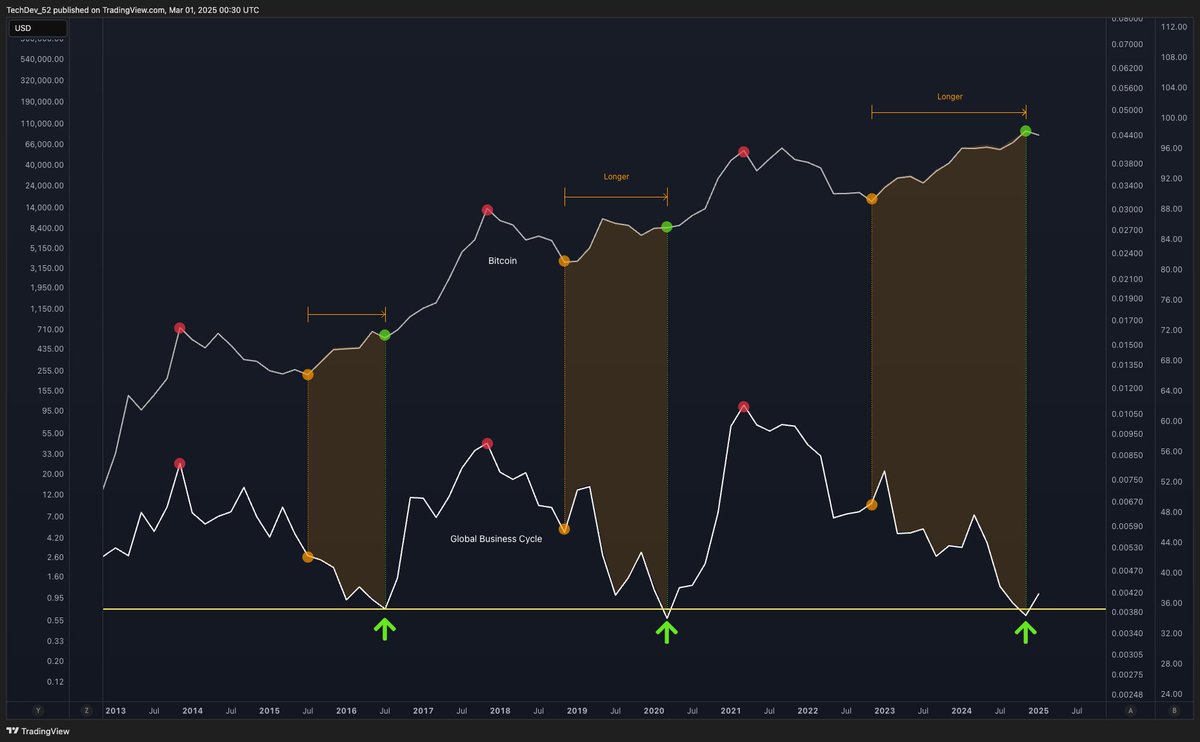
And remember, most people are overcomplicating the idea that Bitcoin’s traditional four-year cycle can extend. It’s simple. If the business cycle extends, the crypto cycle extends (chart 4).
Bitcoin is a macro asset…
A RECESSION IS COMING.
WHEN?
END OF 2025.
EARLY 2026.
MOST PEOPLE WILL NOT BE READY.
I WILL.
BECAUSE I HAVE ONE GOAL THIS CYCLE:
Sell the top.
Buy back the bottom.
How?
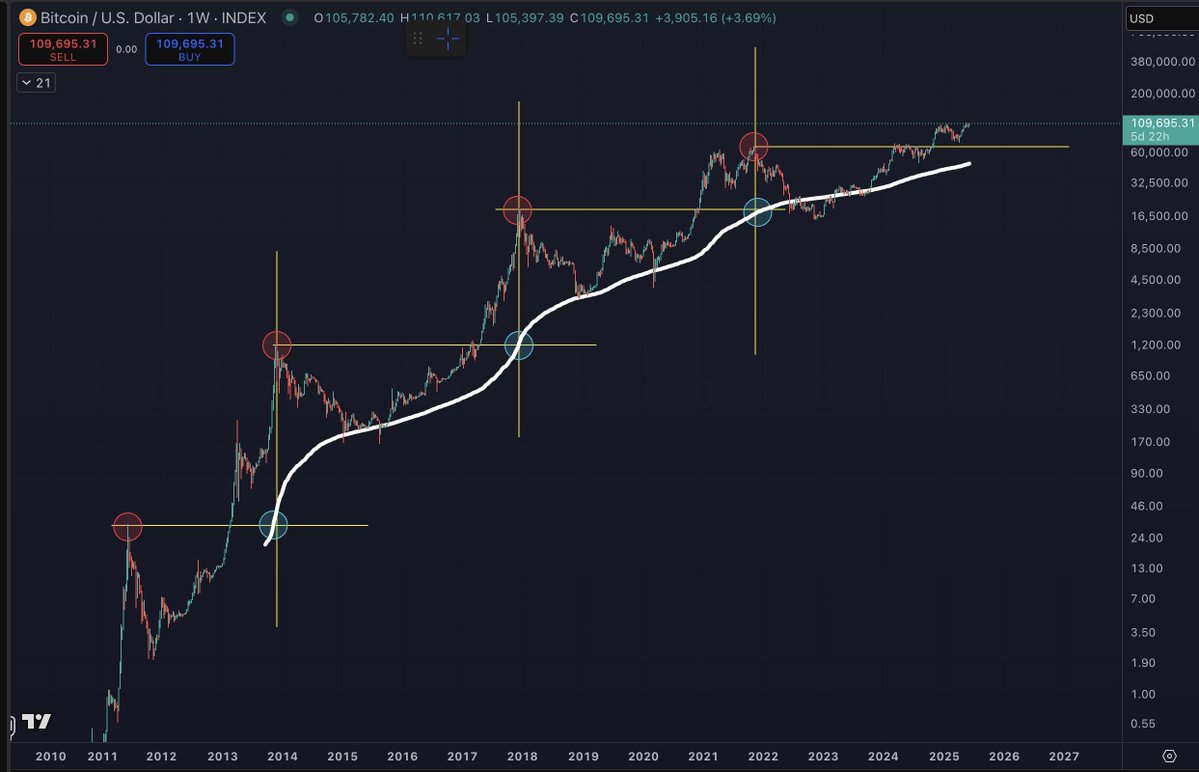
This chart.
The 2-Year Moving Average Multiplier.
It’s worked every #crypto cycle.
Since 2013.
No noise. Just data.
Every single time Bitcoin touches the red line (2Y MA x5)
The bull run ends.
Market tops.
That’s when I’m out.
But that’s only step one.
Here’s the REAL secret,
I won’t just sell the top.
I will buy back at the bottom.
How?
When Bitcoin drops below the green line,
That’s the 2-Year Moving Average.
And every time we trade under it.
That’s the real bottom.
2014 it nailed it.
2017 again.
2021same story.
The green line is the reload zone.
The wealth transfer level.
Where the next cycle begins.
So my plan is simple:
🔴 Red line I sell
🟢 Below green I buy back everything
Stop guessing.
Follow the lines.
And when it’s time to exit, I’ll say it loud.
And when it’s time to re-enter
I’ll be screaming here too.
Follow me.
Because this time,
You’re either buying bottoms,
Or being someone else’s exit.
Some context for everyone…
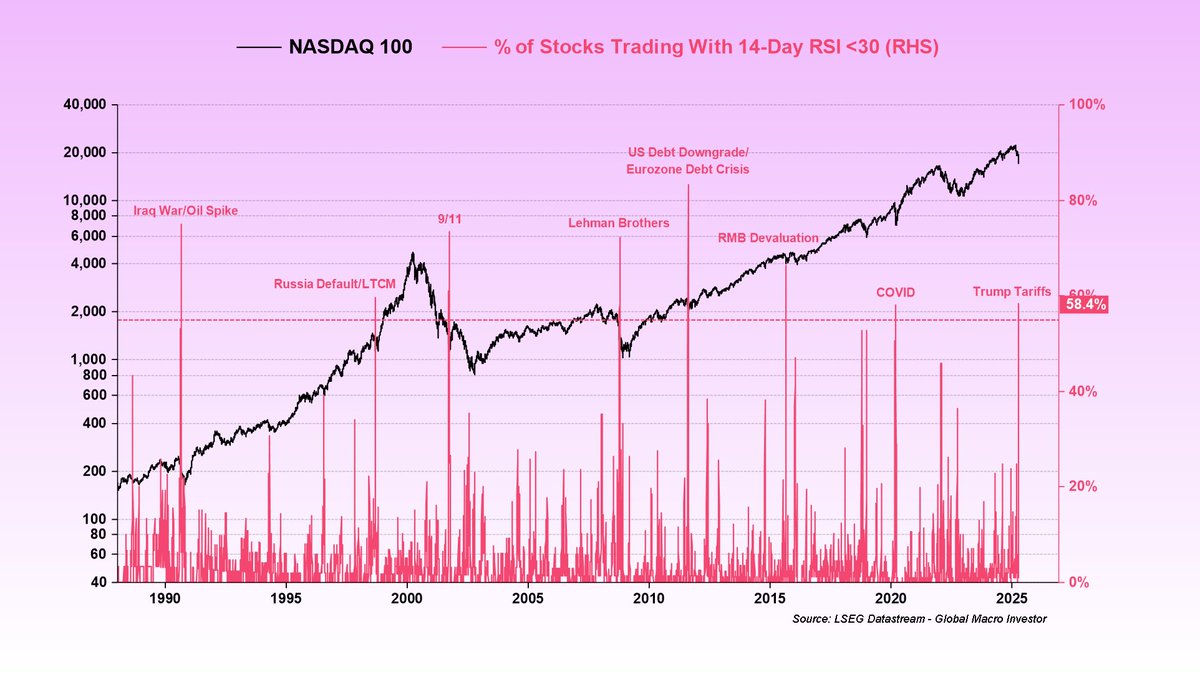
Tech stocks are currently the most oversold since COVID, and only seven other times since 1988 have we seen more than 55% of stocks within the NASDAQ 100 trading with a 14-day RSI below 30:
August 1990 – Iraq War/Oil Spike
August 1998 – Russian Default/LTCM
September 2001 – 9/11
October 2008 – Lehman Brothers
August 2011 – US Debt Downgrade/Eurozone Debt Crisis
August 2015 – RMB Devaluation
March 2020 – COVID
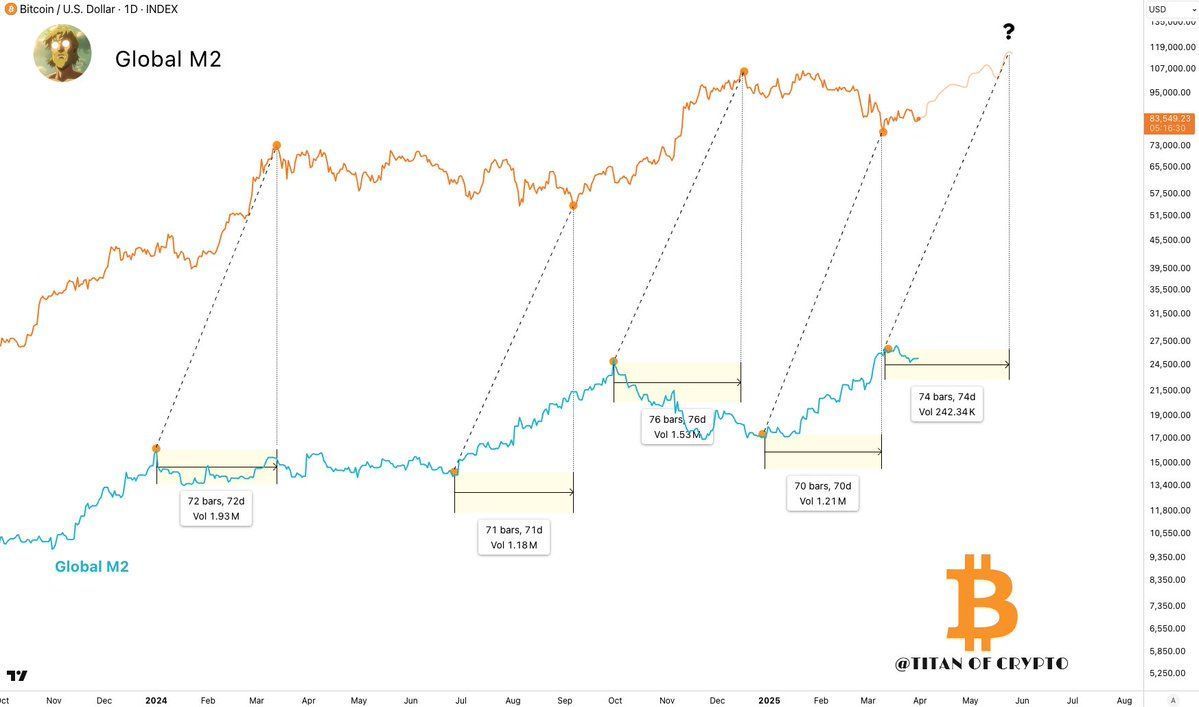
$BTC typically follows the Global Money Supply (M2) with a lag of ~70-76 days
If this holds true, we can expect new ATHs for Bitcoin around May
So, DCA at these prices while you can 🙌
Source: Washigorira
Here are the major categories to keep on your radar for the White House crypto summit this Friday. 👇
• ETF contenders
• Tokens made in USA
• Tokens mentioned by Trump
• Projects attending the summit
I would pay close attention to the tokens that have overlapping themes.
We’re giving away this insane @BoredApeYC MAYC!
Like, repost, and follow @MutantHounds to stay tuned for more details. Tag some friends who aren’t in the club yet.
!HOWL