I can be quite critical of control charts' capacity to falsely reassure us. But when SPC switches to 'process capability' mode, its visual language doesn't pull any punches.
@alistairsteel If we did this, we'd group together the 'bad' weeks, and group together the 'good' weeks (maybe better to call them the 'less bad' weeks in this example), and we'd see if we could deduce cause-and-effect mechanisms from the comparisons.
This has turned into something more like a blogpost than an X post, but – if they can be bothered to read this 16-post thread (!) - I’d be hugely grateful for the views of @TomPMarshall, @alistairsteel, @StuartNuttall1, @jim_crawfurd and @ShaneWelter on this idea…
1/16
@alistairsteel I also agree that the way forward in an example such as this should not involve "reacting to individual fluctuations". But what if we use control charts not as real time monitoring tools but as a basis for cold case detective work?
@alistairsteel Thanks. Yes, I agree that to improve this process requires changing the underlying system. But - paradoxically - the way control charts are designed and presented can prevent managers from seeing this. It's too easy to get 'false reassurance' from control charts.
@ffolliet A few years ago I used to teach a session on presentation skills to healthcare data analysts in the East Midlands. I would introduce them to your p³ idea and direct them to your blogposts. I personally think your p³ framework is incredibly useful.
Good design in a presentation is about function, not decoration. Those who are intend (p2) to be a script and handout and document will design it differently from those who intend to add value to their message.
https://t.co/PonSkTnFcS
@ffolliet NHS data analysts hardly ever do presentations these days. I mean, they didn't do very many of them before! But now they just seem to think that slapping a metric on a dashboard - and hoping someone glances at it - counts as communication. I find this disappointing.
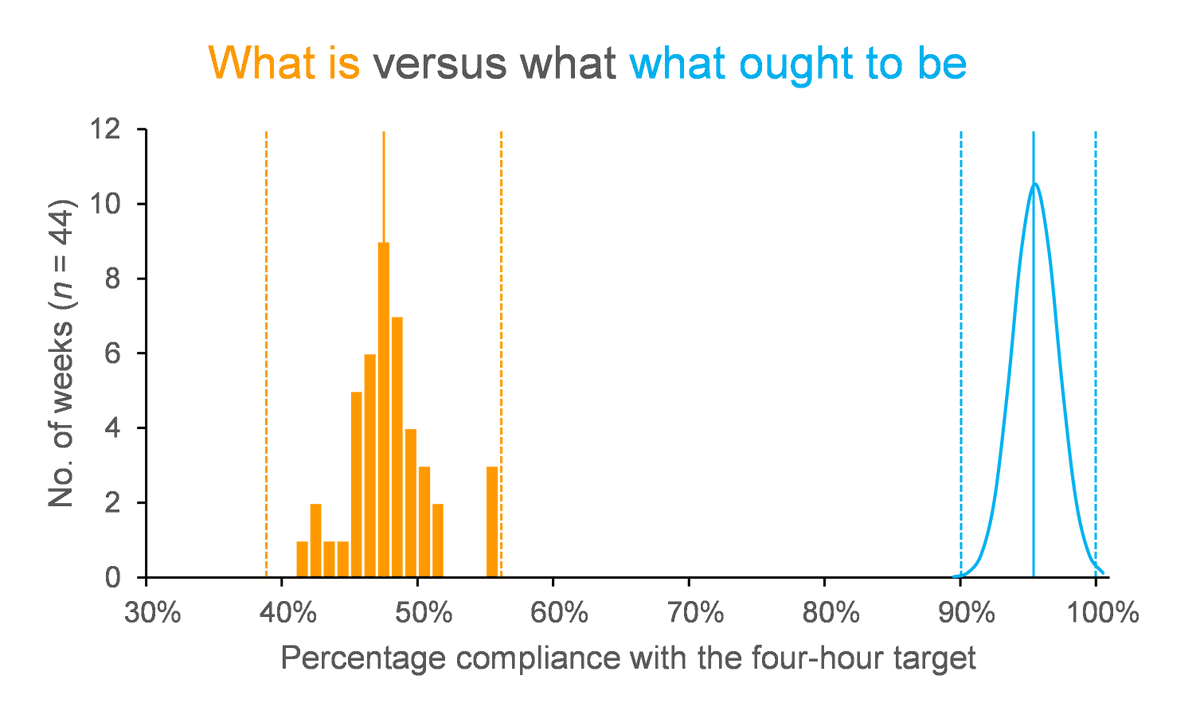
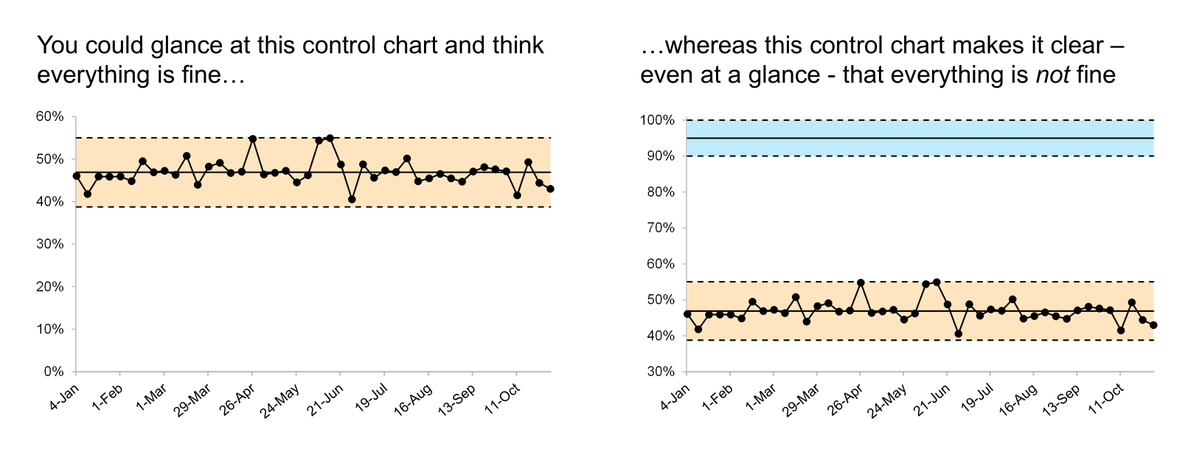
This is a control chart showing compliance with the four-hour target at a medium-sized general hospital. Each dot is a weekly compliance value, and the period covered is the first 40 weeks of 2026. On average it was achieving 47% compliance with the four-hour target.
1/12
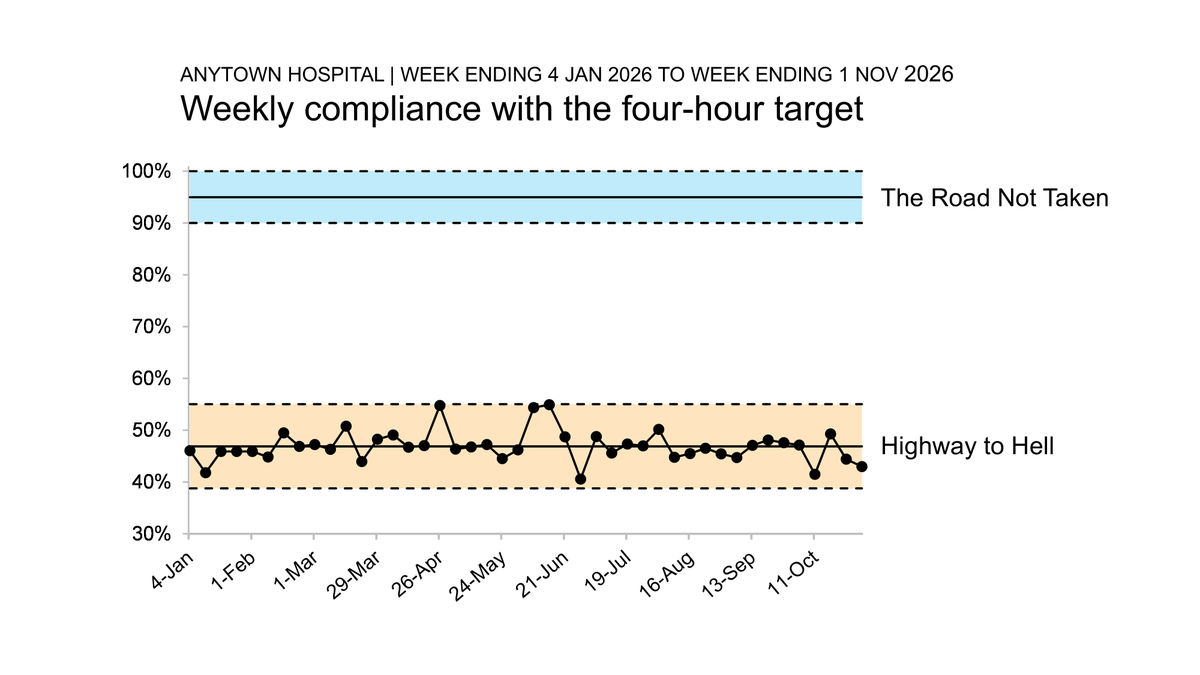
And until we see some improvement in this indicator, we should probably append a thoroughfare-themed label to the blue specification zone, too.
It's hard to look at this chart and be lulled into a false sense of complacency now.
12/12
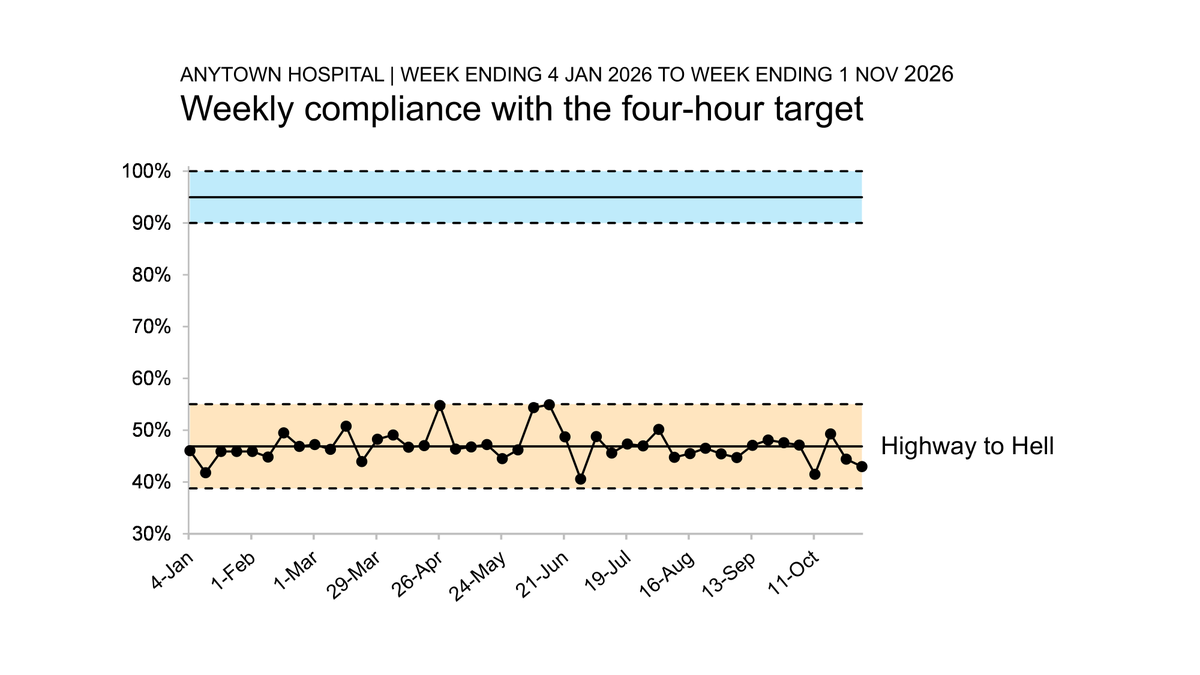
The yawning gap between where we are and where we ought to be should help counter any complacency created by the original design. But to make things really clear, we could add a label to the orange control zone. And we could stick with the lane markings metaphor.
11/12