FOMC decides tomorrow and most people are still trading the wrong scenario.
everyone's been waiting for "the cut." that narrative flipped months ago. this is no longer about when the fed cuts
it's about whether they hike.
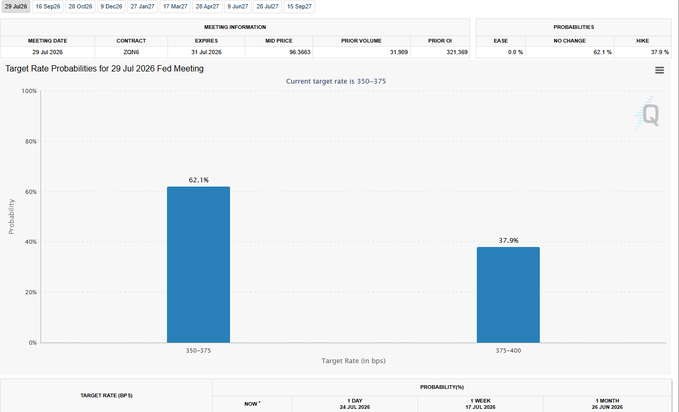
current odds
~66% hold, rest leaning toward a HIKE, not a cut. this meeting also has no dot plot no SEP this cycle so the only signal is the statement + warsh's presser tone.
why hike risk is real: oil above $100 on the iran war escalation, inflation still above target, and nearly half of FOMC members already said in june they'd support a hike later this year if inflation doesn't cool.
for context on how sensitive crypto is to this right now: BTC dropped below $63k in june off hawkish SIGNALING alone no actual hike, just tone. an actual hike this week would likely hit harder.
the 3 scenarios:
🔴 hike (real possibility, not priced as unlikely anymore) → sharp risk-off, worst case for crypto
🟡 hold + hawkish tone → still leans negative, avoids the worst case but no relief
🟢 hold + dovish tone opening the door to september → the actually bullish outcome, and currently the LEAST likely of the three
my take: risk/reward into tomorrow favors caution over positioning for a dovish surprise. this is one of the bigger macro catalysts left this quarter — expect real volatility around 2pm ET either direction.
not financial advice, just reading the setup as it actually stands right now 🦅
this "6-year yield curve" model called BTC's cycle tops perfectly... for the first two cycles. then it broke. twice in a row.
how the model works: it maps BTC's price today against its price 6 years earlier, using that ratio to project the next cycle peak.
2013 → 2018 projection: nailed it
2018 → 2021 projection: nailed it (called ~$60k, actual print ~$69k)
then it stopped working:
2021 → predicted 2022 top: ~$98k. actual: nowhere close. bug.
2022 → predicted 2026 top: ~$200k. actual right now: ~$65-126k range. bug again.
two clean hits, then two straight misses. that's not noise
that's a pattern that worked when the market was smaller and more reflexive, and stopped working once BTC matured into a bigger,
more institutionally-driven asset. bigger market cap, slower compounding, less room for the same exponential multiple every cycle.
worth remembering next time someone extrapolates
a chart pattern straight into a six-figure target: the model that called the last two tops correctly is the same one that's whiffed the last
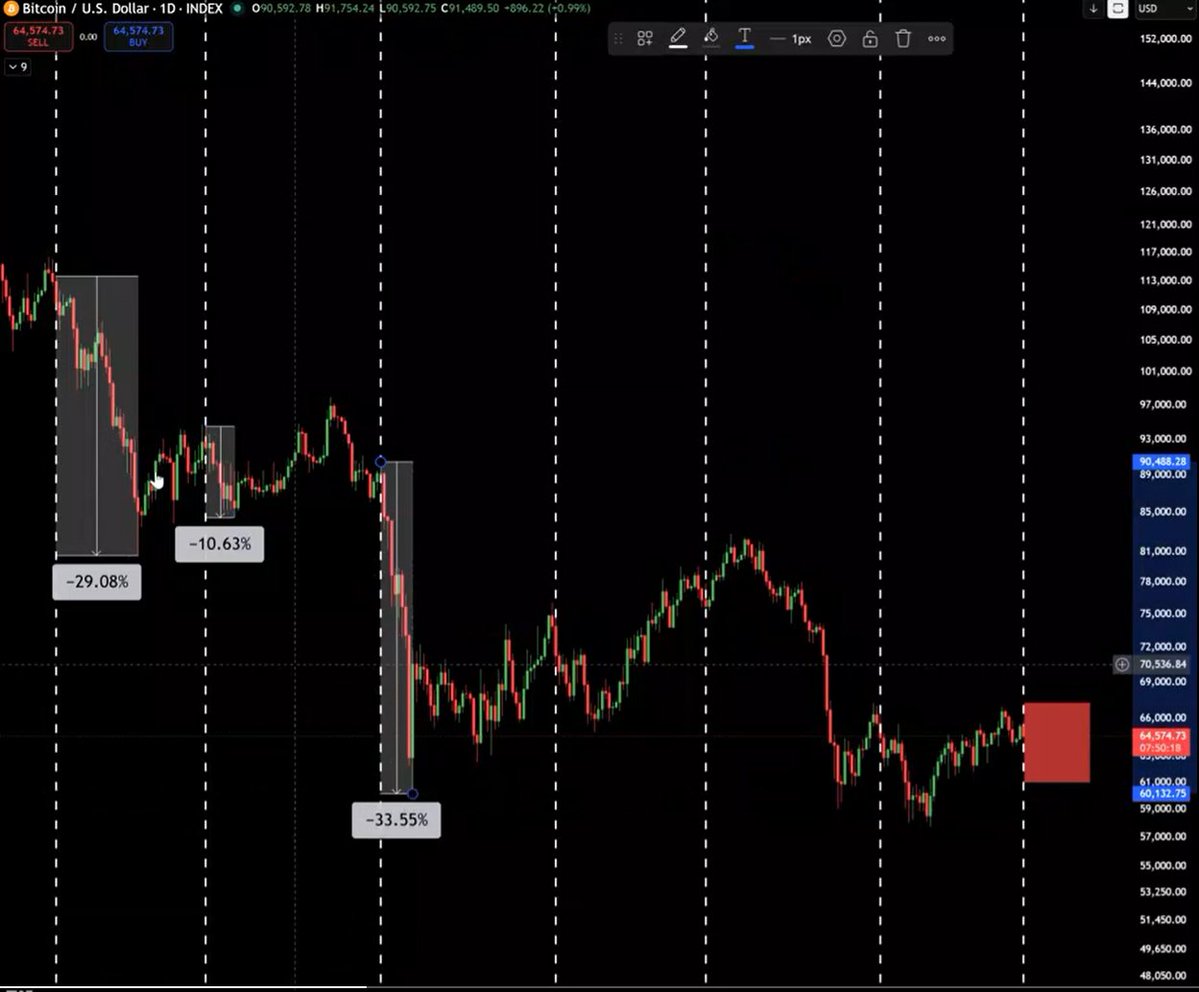
🔥 the way people measure the scale of crypto crashes is wrong and that's exactly why, to me, $BTC still hasn't bottomed.
mt gox and FTX weren't normal blowups. they were the trigger points for market-wide panic selling.
mt gox (2014): handled ~70% of global BTC volume at the time. one exchange collapsed, and the entire market lost liquidity for years afterward.
FTX (2022): marketed as a "safe haven," backed by major funds, government relationships, media coverage. still collapsed, still left a multi-billion dollar hole, still triggered a domino chain across everything connected to it.
if even the biggest CEXs the ones backed by institutions can collapse like that, how much room is left for the next layer down? unaudited small projects, DEXs nobody's heard of, meme coins? look at the recent wave of hacks and rug-pull suspicions. that's your answer.
so where are we in this filtering process?
looking at the speed and scale increasing over time (gox → FTX → whatever's next), my read is we're maybe 1/3 of the way through this cycle's shakeout.
the rest won't be gentler.
this is a personal take, not financial advice but if it's right, what people are calling "the bottom" might just be one stop along the way.
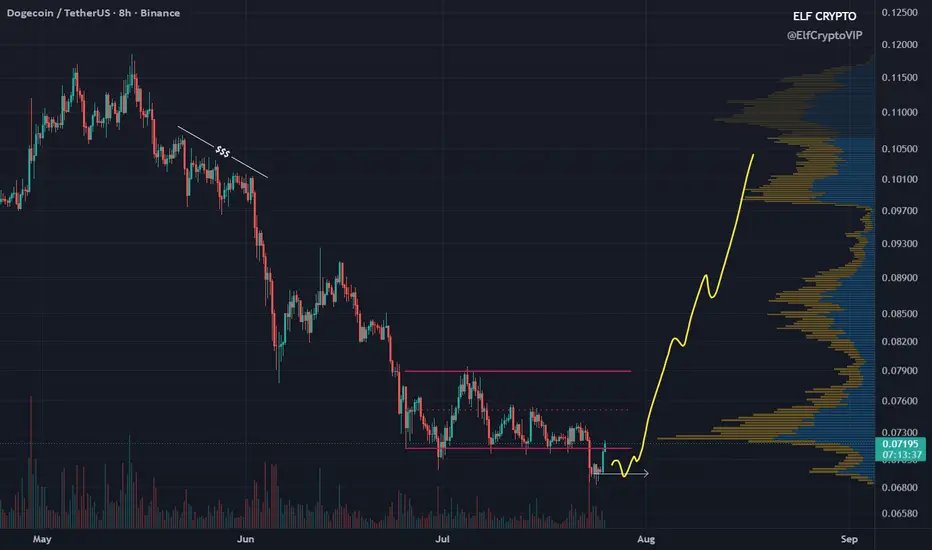
$DOGE is coiling right at the bottom of a range that's held since june and volume profile shows a massive gap of untouched liquidity sitting right above it.
structure: price broke below the $0.070-0.073 range floor, now retesting it from underneath.
the volume profile (right side) shows almost nothing traded between $0.075 and $0.105 that's a low-resistance liquidity void. if this reclaims the range, there's very little supply sitting in the way of a fast move back toward $0.10+.
that's the setup, not a guarantee: this is what a "coiled spring" looks like on a chart thin volume above means air pockets, not resistance, if it breaks.
the range floor around $0.068-0.070 is what invalidates it lose that and this is just continuation of the downtrend, no reclaim story.
not financial advice, just flagging where the actual liquidity gap sits 📊
US-Iran conflict update: 13 consecutive nights of US strikes on Iran, then an unusual pause overnight
no new strikes for the first time since the ceasefire collapsed.
context: Trump said this week he's "close to making a decision" on what he's called a potential "massive attack," larger than prior operations. at the same time,
Trump also told reporters the US and Iran remain in active talks and Tehran is "getting more serious" so the pause could be de-escalation, or it could be a lull before both outcomes play out (negotiation or a larger strike). trump himself has said both are still on the table.
separately: retaliatory rhetoric has escalated on both sides
Iran has signaled proportional retaliation against US personnel, and Trump has said Iran would "pay many times over" for US casualties. UK has pulled some diplomatic staff from Iran, several airlines have suspended regional routes.
market-relevant angle:
🛢️ oil already broke above $100/barrel this week amid Red Sea tanker attacks and Strait of Hormuz tensions
📈 continued escalation risk keeps upward pressure on oil → inflation expectations → makes fed rate cuts less likely, not more
📉 that combination (higher oil + delayed cuts) is a headwind for risk assets broadly, crypto included not because of the war directly, but because of what it does to the inflation/rates picture
markets are closed over the weekend, so any material escalation or de-escalation news gets priced in all at once monday. worth watching the situation over the weekend rather than assuming it's already resolved.
this is a genuinely fluid situation will follow up as it develops.
gold aka $XAU just completed a 5-wave impulse and the elliott count says one more leg down before this reverses.
structure: clean 1-2-3-4-5 up from the 18th, now correcting in an ABC currently inside wave (5) of C, targeting the 2.618 fib extension zone right around $3,993, tagged as "end wave 5."
the trap sitting above it: sell zone at $4,028-4,032, right where strong liquidity is resting. if price pops into that zone first before the final flush, that's the shakeout — not the reversal.
the actual setup: wave (5)/C completing near $3,993-4,000 (right on the uptrend trendline + support) is where this wave count says the correction ends. reversal from there targets back up through the sell zone toward $4,050+.
so the sequence to watch: possible fake pop into $4,028-32 first, rejection, flush to $3,993-4,000, then the real reversal.
not financial advice, just tracking where this wave count says the correction actually finishes 🟡
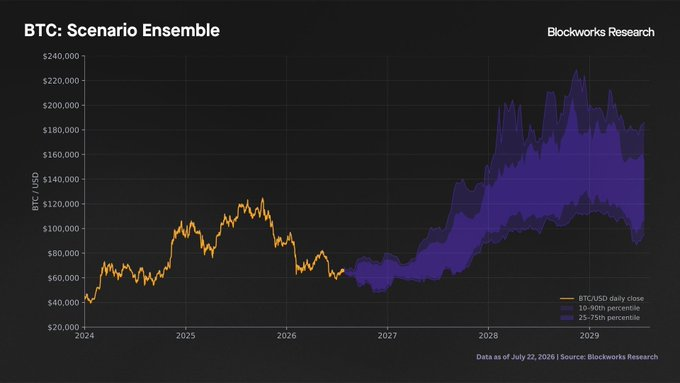
blockworks just dropped their full $BTC scenario ensemble through 2029, and the timing is what makes this worth paying attention to.
this comes right after BTC finished a 40-week decline, down 50% from the october ATH. not exactly a moment people expect bullish research to drop.
but blockworks' head of research flagged something specific: a set of rare, high-timeframe indicators that have historically only shown up at major cycle bottoms and every time they've appeared before, they preceded years of outperformance, not more downside.
what the ensemble actually shows:
🟣 the near-term bands (10-90th percentile) stay compressed and mixed through the rest of 2026 no clean directional call short term
🟣 but the median path turns decisively positive starting 2027, and the spread widens asymmetrically to the upside through 2028-2029
🟣 that shape (tight now, exploding upside skew later) is what a base-building phase looks like on a probability model, not a dead trend
translation: the model isn't saying "BTC pumps tomorrow." it's saying the current pain is structurally consistent with reaccumulation, and the payoff shows up on a multi-year horizon, not a multi-week one.
this is exactly the kind of setup that's easy to dismiss while you're living through the drawdown, and obvious in hindsight once the next leg is already underway.
not financial advice, just flagging research that's calling this moment differently than the price action feels right now 📊
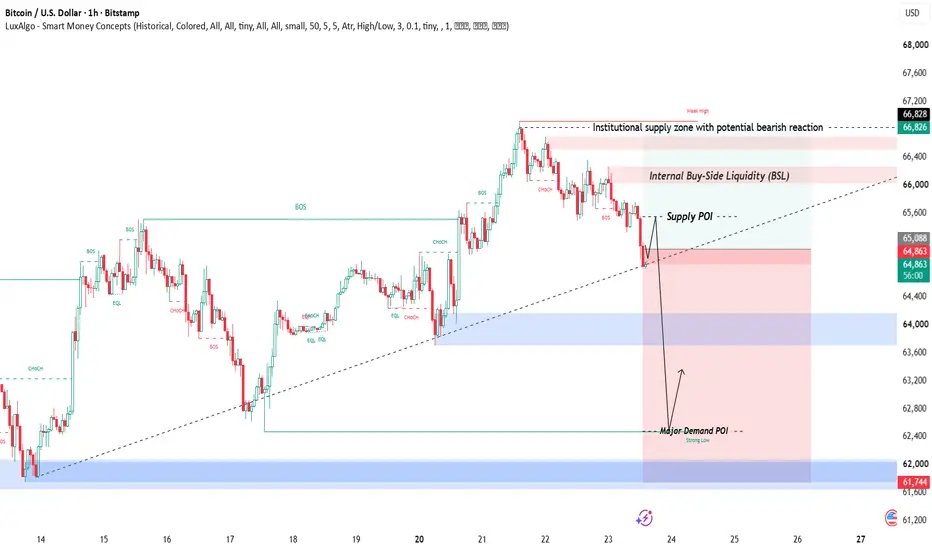
$BTC just tagged an institutional supply zone at $66.8k weak high already flagged, first bearish reaction confirmed.
structure on the 1h:
🔴 clean series of BOS/CHoCH the whole way up from the 14th trend's been genuinely bullish, not luck
🔴 but price just ran straight into a supply POI at $66.4-66.8k where liquidity was resting above the internal BSL exactly the kind of level smart money sells into
🔴 rejection from here targets the major demand POI down at $62-62.4k that's the "strong low" that's held every retest so far
so this isn't "the uptrend is dead." it's "the uptrend just hit the level where it needs to prove itself."
if $62-62.4k holds as demand, this is a normal retracement inside a bigger trend. if that level breaks, the whole structure since the 14th is in question.
reaction already started off the supply zone question now is whether the demand zone catches it or not.
not financial advice, just tracking where the liquidity actually is 📊
gold just flipped its structure and is sitting right at the pivot that decides the next leg.
what happened: BOS (break of structure) confirmed off major support near $4,000, CHoCH followed right after that's the market flipping from bearish to bullish internally. price is now basing in the pivot/entry zone around $4,116, right where the FVG (fair value gap) sits.
the roadmap from here if this holds:
🔵 resistance 1 at $4,187 — first test, already tagged once (marked "strong high")
🔵 resistance 2 at $4,343 — next liquidity pocket above
🔵 resistance 2 (upper) at $4,514 — the bigger target if momentum carries through
this mirrors the exact same BOS → CHoCH → pivot → impulsive rally structure that already played out earlier in the move up from july. structurally, gold is sitting in the same spot right before
FOMC meets july 28-29. this one's more dangerous for crypto than people are pricing in.
context most people are missing: markets spent all of 2026 expecting a cut. instead the fed's SEP in june flipped hawkish — raised the median year-end rate projection to 3.8% and signaled ZERO cuts this year. that was already a shock.
now, as of today: markets are pricing a 1-in-3 chance of an actual HIKE next week. not a hold. a hike. driven by energy prices climbing and fed officials (cook, jefferson, waller) openly warning inflation at 3.7% isn't cooling fast enough to justify staying patient.
why this matters for crypto specifically:
🔴 this is a non-SEP meeting no new dot plot, no updated projections. the ONLY signal the market gets is the statement language + warsh's presser tone. that means outsized reaction to word choice alone, both directions.
🔴 a hike (even 1-in-3 odds) repricing higher = real yields up = dollar strength = the exact environment that's crushed BTC every time it's happened this cycle
🔴 a hold with hawkish language ("still watching inflation closely") is the most likely outcome and is NOT automatically bullish it just avoids the worst case
🔴 the only genuinely bullish outcome is a hold paired with dovish language opening the door to september and that's currently the least-priced scenario
so the setup going into next wednesday isn't "rate decision as usual." it's a real three-way fork with the bearish tail risk (hike) sitting at meaningfully higher odds than normal.
position for volatility around the 2pm ET release either way this is a binary-ish event dressed up as a routine meeting.
not financial advice, just flagging the actual odds instead of assuming the usual "fed will cut eventually" script 🦅
$BTC is fighting for its life right at the top of a rising channel, jammed straight into the same zone that capped the entire may-june selloff.
the setup:
🔵 price climbing an ascending channel since the july low, now colliding with major resistance at $65.8-66k
🔵 that magnet zone up top ($72-74k) is where this drops if the channel breaks up clean
🔵 the magnet down at $58-60k is where this goes if the channel fails here
this is the exact spot both scenarios are still alive. no confirmation yet just compression right into resistance.
if it clears $66k with volume, this squeeze resolves up toward the magnet. if it rejects and loses the channel trendline, expect a fast trip back to test $58-60k.
no edge in guessing here, the level decides it. watching for the break either way 👀
CLARITY Act update — where it actually stands right now.
this is the bill that decides whether a token is an SEC security or a CFTC commodity. bigger than GENIUS — GENIUS only covered stablecoins, this covers the entire market.
progress so far:
🔵 House passed it 294-134 (most bipartisan crypto vote in history)
🔵 Senate Banking cleared it 15-9
🔵 merged draft (70+ pages) dropped mid-july, floor vote targeted this week
what's actually blocking it: 7 Democratic votes needed for the 60-vote threshold. the dealbreaker isn't technical — it's an ethics provision barring officials (including the president) from holding personal crypto stakes in office. dropped from the current draft, and democrats are treating it as non-negotiable.
the window: if this doesn't clear the senate by ~aug 7 recess, lummis says the next real shot could be 2030 — this congress ends jan 2027, bill dies with it.
polymarket odds: 82% in feb → crashed to 24% two weeks ago → back to 45% after the text drop. that's how binary this actually is right now.
even a senate pass isn't the finish line — house has to approve the final text, then trump has to sign it.
not financial advice. but this is one of the last real structural catalysts sitting in front of crypto this year. worth watching closer than the price chart this week 👀
$BTC just squeezed into the exact convergence point that's been building since the 21st, and it's testing resistance right now.
the full structure:
🟦 broke out of a descending channel late june, turned around, and has been riding a rising trendline since
🟦 that trendline just converged with the falling resistance line from the seller zone above classic
triangle squeeze, and price is at the tip of it right now
🟦 already bounced off resistance twice this week, third test happening now at $66,400
this is the moment the triangle resolves. squeeze this tight after a multi-week range almost never stays quiet it breaks one direction with real momentum.
if it clears $66.4k clean, TP1 sits back near $63.8k as the retest zone on a pullback before continuation. if it rejects here a third time, expect this to roll back into the range below.
2-year revenue by protocol. this list tells you exactly where the real money in crypto actually flows.
Tether — $11.23B
Circle ($CRCL) — $4.16B
Hyperliquid ($HYPE) — $1.17B
Pump ($PUMP) — $1.14B
Phantom — $547.98M
Axiom Pro — $440.11M
Sky ($SKY) — $430.72M
Aerodrome ($AERO) — $375.44M
Photon — $353.45M
Jupiter ($JUP) — $299.55M
Fragment — $269.84M
EdgeX — $251.24M
MetaMask — $227.84M
Aave ($AAVE) — $210.38M
look at the gap between #1 and everyone else. tether alone is doing more revenue than the next 10 combined. stablecoins aren't a "sector" in crypto anymore — they ARE the industry's actual cash flow.
second thing that stands out: $HYPE and $PUMP sitting at $1B+ revenue is wild for how "new" both narratives feel. perp DEXs and pump.fun-style launchpads are generating real fees, not just volume theater.
this is the list to screen from when someone asks "which protocols actually make money" instead of just farming TVL or emissions.
bookmark this 🔖
silver aka $XAG is testing the descending trendline that's rejected every single bounce since the 3rd.
structure: clean lower highs, lower lows the entire way down from $62 — this is the 4th touch of that trendline, and price is basing right into it now around $57.
if it breaks: this is the level that flips the whole structure. clears the trendline → next stop $60 (prior resistance), extension toward $62 (the origin of this entire selloff).
if it doesn't: this rejection zone at $57 has already produced the sharpest leg down on the chart once before. rejection here sends this straight back to $55.
this is the moment that decides whether the downtrend actually breaks or just fakes one more bounce before continuing.
not financial advice, just watching whether this trendline finally cracks 🥈
hedge funds just did something they haven't done in a decade.
goldman's prime book shows tech exposure spiked to the highest level since they started tracking this in 2016 — then got dumped just as fast. 4 straight weeks of net selling, the largest de-grossing in tech in 10 years.
this isn't panic selling though. that's the part people are missing.
selling was concentrated in long reductions, not new shorts — funds trimming winners, not betting against the trade. semiconductors and mag 7 names led the unwind specifically because they'd become so crowded that normal portfolio limits forced mechanical selling, even while funds still believe in the thesis.
translation: smart money isn't calling the top on AI/tech. they're taking profit on the most crowded trade in the market and rotating into what's NOT crowded — commercial services, staples, real estate, energy.
this is what "climbing a wall of worry" actually looks like on a chart. spike this violent, unwind this fast, almost always means one thing: positioning got way ahead of itself and just reset.
watch what happens next: if funds start rebuilding tech exposure from these lower levels, that's usually the real signal, not the spike itself.
not financial advice, just reading how the smart money actually trades crowding 📊
BTC's been trapped in a descending channel since october, and right now it's coiling inside a smaller ascending channel near the top of that structure — this is the exact spot that decides august and september.
the elliott wave count on this: completed a 5-wave impulse down (labeled 1-5), corrective ABC bounce, now inside a WXY structure building right under the descending channel's upper boundary.
the level that matters: as long as price holds inside this ascending channel, this could still be building toward a breakout attempt. but the second it slips below the channel's lower bound, the bigger descending structure reasserts itself — and that points toward $56.5k.
so the next few days aren't just noise. this is the range that decides whether BTC breaks the downtrend or confirms it's continuing into fall.
not financial advice, just tracking the structure through a messy summer chop 📉
$ETH just printed a break of structure and the smart money concepts on this chart are lining up for a much bigger move than people realize.
structure since june:
🟢 clean CHoCH (change of character) off the june low, first sign trend was flipping
🟢 that flip built into a BOS (break of structure) — confirmation the downtrend is officially over
🟢 price is now basing right inside an order block at $1,800-1,900 — the exact zone institutions typically re-accumulate before the next leg
this is the same pattern that played out from feb to may — CHoCH → BOS → continuation into a much higher high (2,400+). structurally, ETH is sitting in the same spot right now that it was in right before that entire leg up.
if this order block holds as support, the structure points toward a retest of the prior highs and beyond — not a slow grind, a real impulsive leg like the one that already happened this cycle once.
the "strong high" from earlier this year is still unbroken. this setup is what a retest attempt looks like before it happens, not after.
not financial advice, just reading the market structure 📊
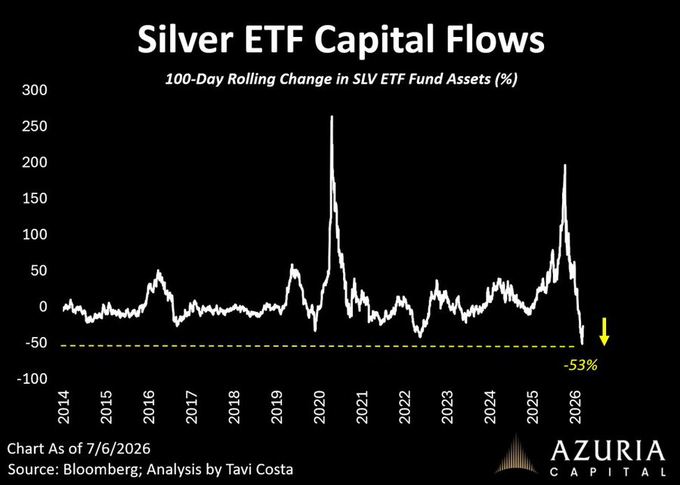
silver ETF capital just did something it hasn't done in over a decade.
100-day rolling change in SLV fund assets just crashed -53%. that's the sharpest capital flight since this chart started tracking in 2014 — worse than 2020, worse than every prior flush.
normally this means one thing: get out, silver's dying.
except silver price is still sitting near $50/oz — close to record highs. capital is fleeing the ETF wrapper while the metal itself refuses to crack.
that divergence is the actual story. paper hands are dumping SLV shares, but physical demand and price action aren't following them out the door. either this is profit-taking rotation into physical/other vehicles, or ETF flows have stopped being the signal everyone thinks they are.
historically, this kind of capitulation in fund flows — while price holds — is what shows up right before a base, not right before a breakdown.
not financial advice, just flagging a divergence that doesn't happen often 🥈
bitcoin:native just bounced into resistance and the setup says this bounce is a trap, not a reversal.
structure on the 30m:
🔴 price rejected right at the top of the $63.8k-64k supply zone — same level that's capped every attempt to reclaim since the drop started
🔴 two failed pushes into that ceiling, both getting sold straight back down
🔴 if this zone holds as resistance, this rolls back over into the green zone below — $61k-62.6k is the area getting revisited
so the read: this isn't "the bottom is in." it's a relief bounce running straight into the exact level that's been rejecting every bounce for days.
until BTC actually closes above $64k with volume, every push up into this zone is a fade, not a breakout.
not financial advice, just watching whether this resistance finally breaks or does what it's done every time so far 📉