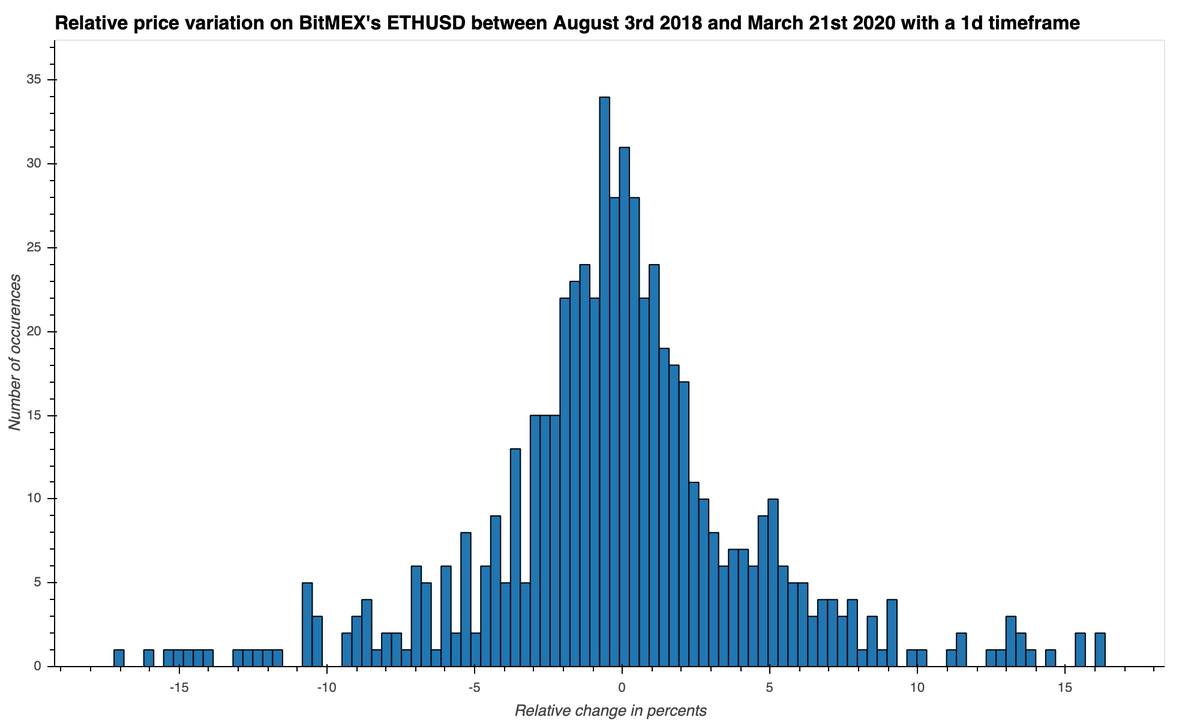
Here are the plots of this morning's analysis: we can see that in the 5min plot, the data is a near-perfect Gaussian while in 1d it's much more rough. Not drawing more conclusions than that though...
Three things:
1. Instictively, I felt that there were more big movements in hourly timeframe but it seems not to be the case.
2. For me, this exercise provided interesting insights about what timeframe to work with.
3. Always start with simple analysis!
5/5
What I learnt today, on BitMEX's ETHUSD contract, looking at the period from March 22nd 2019 to March 21st 2020 (didn't download fresh data for a while...)
1/5
In daily timeframe (on all available data this time, not only a year), the change was lower than 3.8% in 69% of cases. That means that it was higher than that in 31% of the cases.
4/5