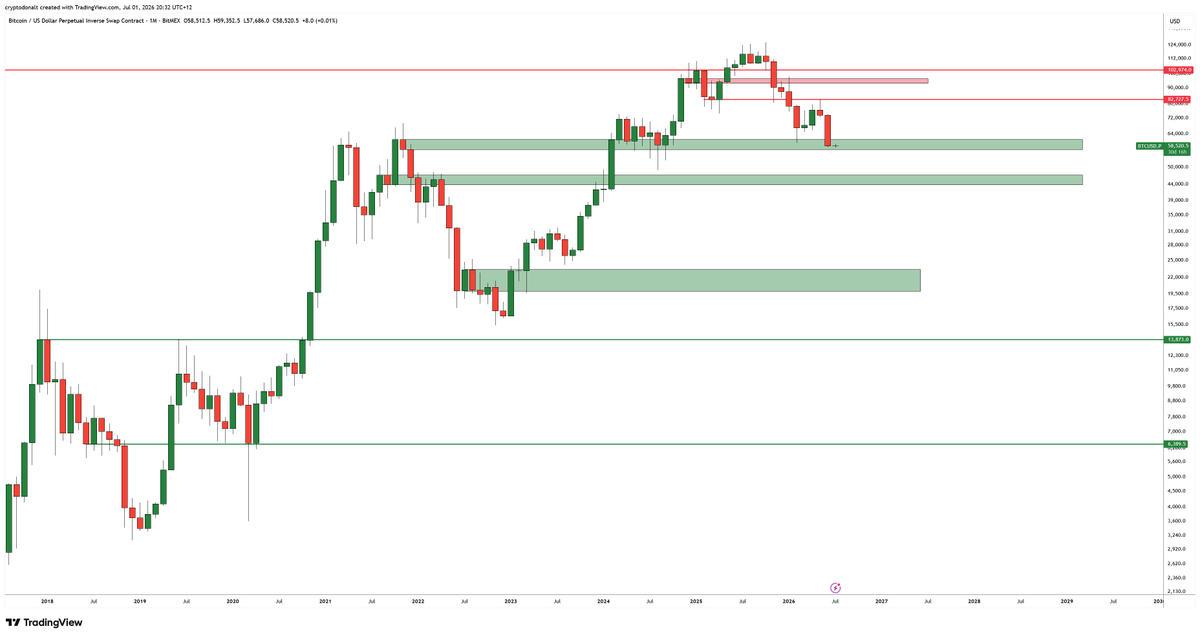
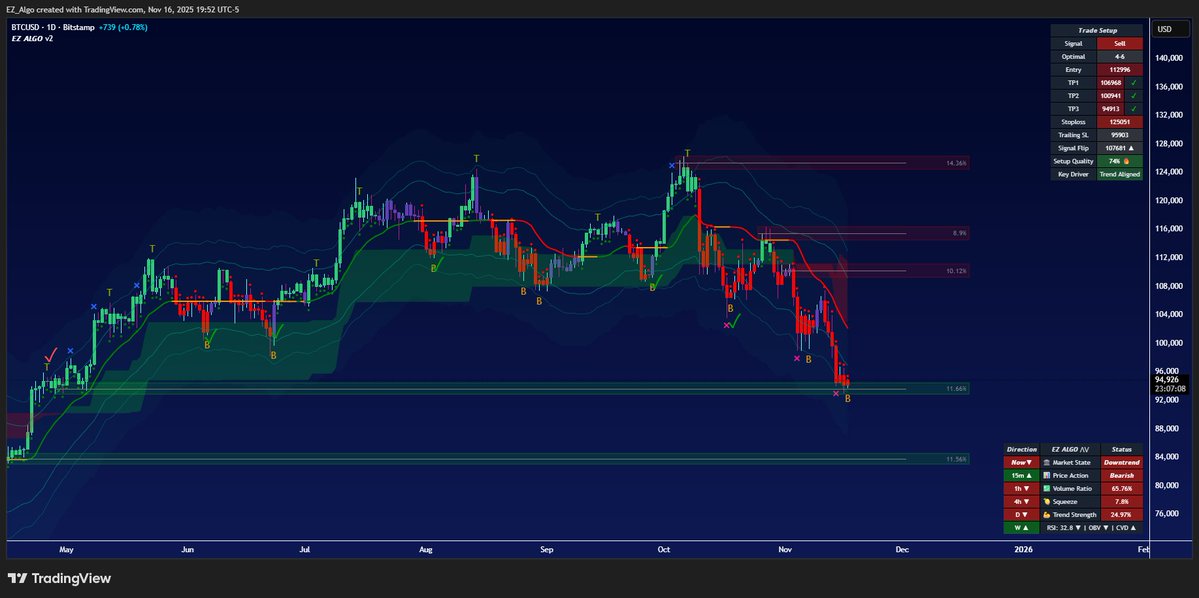
$BTC
Closed at $60k support
There is a world in which something goes terribly wrong and we wick towards $45k this month
If so it's a buy IMO
If not 60k seems good
I bought a little bit at support a while ago
Will add big if $45k happens
Will add smol if we reclaim mid 60s
There are so many positives to cover from $BB earnings that it’s just not possible to do.
Massive amount of US gov contracts from military to the white. I’ll try to condense everything into this thread. The growth trajectory of BB is off the charts over the next few years
before every trade, I ask two questions:
is the context clear and high probability?
if this trade loses, would I take it again?
if either answer is no, there’s no trade
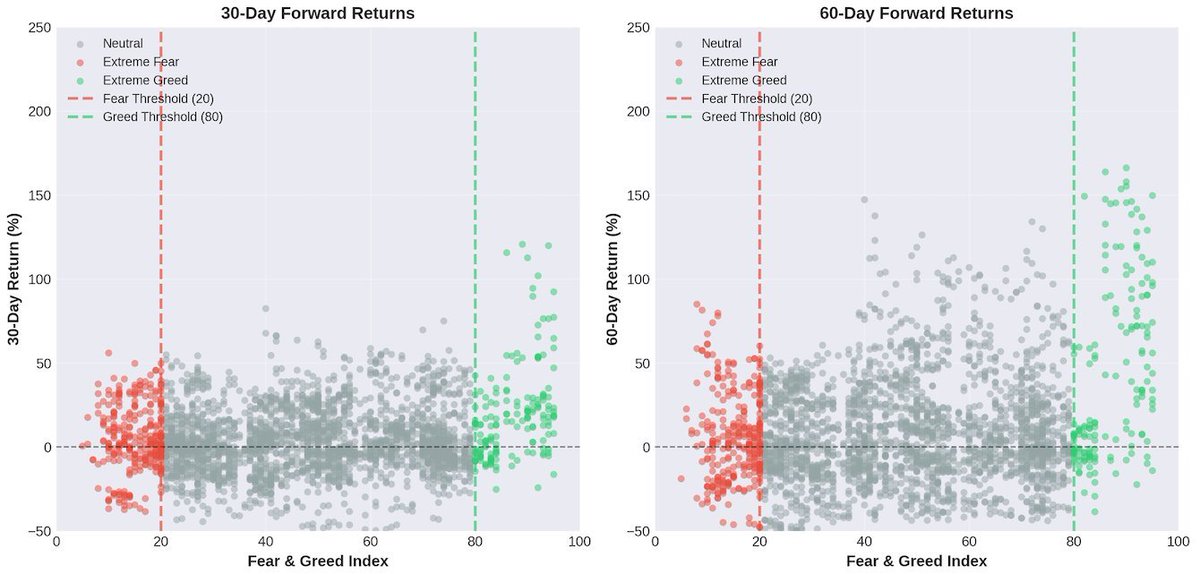
One last note on the Fear & Greed Index
When people encounter the Fear and Greed Index in their feeds, they typically operate under a straightforward assumption:
• low index values predict positive future returns
• high index values predict negative future returns
In other words, the index functions as a mean reversion indicator: when markets are overbought (extreme greed) or oversold (extreme fear), people expect that prices will revert toward the mean from these extremes.
This is a hypothesis we can test. We can examine actual returns following extreme index readings. An easy and fast way to do this is to plot returns against index values and visually inspect the relationship. Under our mean reversion hypothesis, we would expect to see:
• low index values: data points clustering top left
• high index values: data points clustering bottom right
The results reveal a lot of noise, but also a pattern, particularly in extreme greed territory: the indicator frequently fails during trending markets. When you trade based on overbought or oversold signals, you're essentially positioning against the prevailing trend. In practical terms, this means buying too early in downtrends and selling too early in uptrends.
Instead of confirming our hypothesis, we not only find considerable noise but sometimes even the opposite of what we would expect to happen. Obviously, you can discuss how this approach could be slightly tweaked to improve performance. Criticism is welcome, as always.
My point is: this is a metric influencers love to hype, but as the chart shows, it’s mostly just noise :)
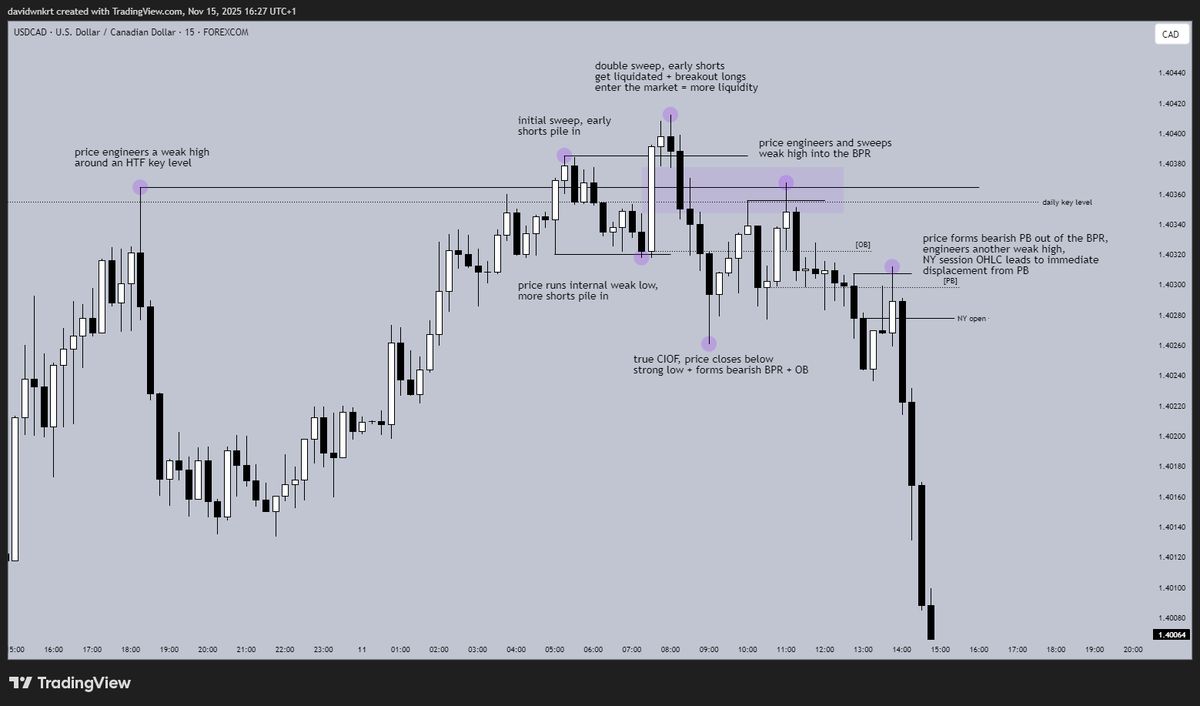
this is how a high probability reversal forms
- HTF key level
- sweep of engineered liquidity
- double sweep
- true CIOF
- double confirmation
- session OHLC/OLHC as entry
When I look back at my own trading journey, and at the journeys of so many traders around me, it’s clear that the way most discretionary retail traders start out is just fundamentally flawed.
In my early days, there was no real structure or process to follow. Everything seemed built for failure, largely because of the same recycled garbage being peddled everywhere, that includes various courses or groups without any real purpose of professional structure - key word ‘professional’
Everyone talks about “edge” and “strategy,” but few ever address how to actually think and operate like a trader.
Over time, you begin to realise what truly matters, the mindset, the approach, and how to build a sustainable career in this game.
No single book or course can teach you that, and they’re not meant to.
Most of what’s out there leans heavily towards technical analysis or trading psychology and mindset, without ever integrating them in a way that reflects the real demands of trading.
Real progress only comes once you start unlearning the misinformation and begin thinking about the game in a more structured and professional way.
The biggest hurdle isn’t the market, it’s the flawed way of thinking most traders start with which is covered well in the book Best Loser Wins by Tom Hougaard and ‘why normal thinking doesn’t win the trading game.’
That last phrase was key for me personally, once you truly understand why, the mindset starts to shift, or at least something clicks.
It’s a great read but don’t expect it to transform your trading overnight, but it does make you question how to approach this game, it’s not the only way of course….
But anyway… it’s a tough game to crack without a professional approach…. Is my 1 cent
Thanks for reading my ramblings…
Cheers
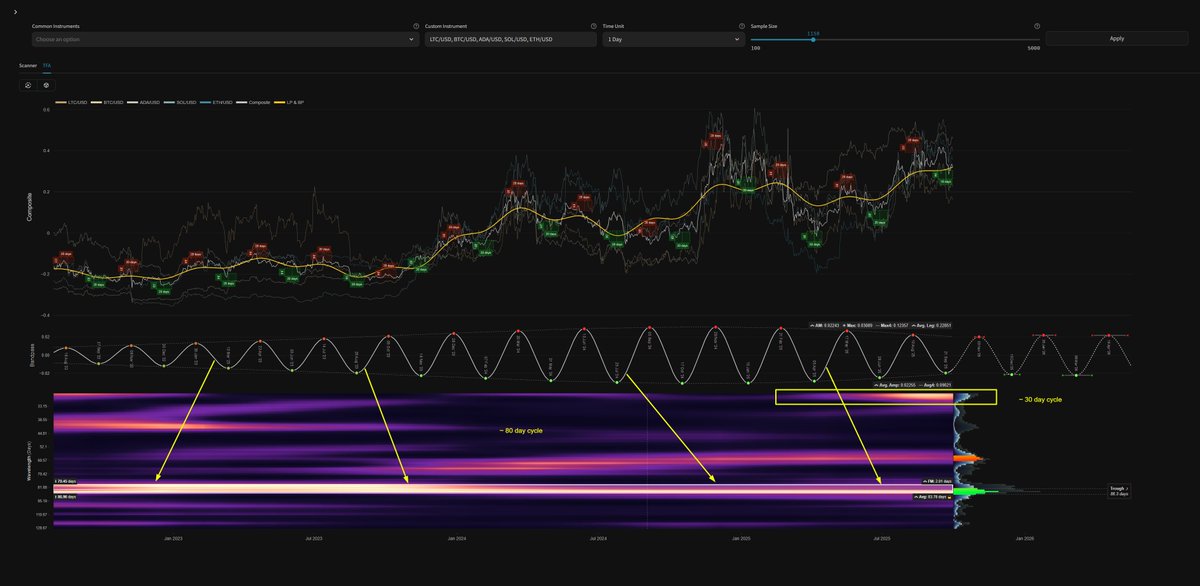
~ 80 day cycle feature in a variety of crypto over the last 3 years. Burst of power at the top right of spectrogram is the recently magnificent ~ 30 day wave.
In this composite: Bitcoin, Ethereum, Cardano, Solana and Litecoin
The Cryptographic Heart Beat 🫀
Since it's rise to dominance in mid 2024, the ~ 30 day cycle in Bitcoin has remained remarkably amplitude stationary.
Only brief excursions above 1SD of the power band during that time (seen in HP below) over 17 (!) iterations.
Below a sample from mid 2024, normal and high passed price action.
Beat on my beauty.