US housing inventory growth is accelerating:
The monthly supply of new single-family homes rose +1.0 month in May, to 10.3 months, the highest since February 2009.
This indicator measures how many months it would take to sell all homes currently on the market at the current pace of sales.
The higher the reading, the weaker the demand relative to supply.
By comparison, the long-term median for this metric is ~6.0 months.
Since the 1970s, 6 of the 7 times this indicator surged to current levels, the US economy was already in a recession.
This comes as elevated mortgage rates and record homeownership costs are keeping buyers on the sidelines, leaving builders with growing inventories that they are struggling to clear.
The US housing market has rarely been this oversupplied.
🔴US margin debt is sending a warning signal that has preceded every major bear market in recent history:
Margin debt rose +$112 billion last month, to a record $1.4 trillion, more than DOUBLING since 2023.
YoY growth in margin debt is up to ~55%, the highest since the 2021 peak.
As a percentage of S&P 500 market capitalization, net debit balances in NYSE margin accounts are up to ~1.5%, materially exceeding the 2000 Dot-Com Bubble levels.
In other words, accounting for the market cap increase, margin debt has grown even faster.
This same signal peaked in March 2000, just months before the Dot-Com collapse, and in July 2007, just 3 months before the S&P 500 topped out ahead of the Financial Crisis.
It also peaked in 2021, ahead of a sharp correction later in 2022.
The signal has never been wrong. The timing always has.
The Fed expanded the money supply by over $9 trillion under Jerome Powell.
Inflation has averaged >4% per year over the past 6 years.
Powell's explanation? It was nearly all due to rolling “supply shocks" over which the Fed has no control.
The truth: this inflation was made in Washington as it always is - from too much government borrowing/spending and too much government creation of money.
BREAKING: US margin debt jumped by +$112 billion in May, to a record $1.42 trillion.
This marks the 2nd consecutive monthly increase, totaling +$195 billion.
Margin debt has surged +$495 billion, or +54%, over the last 12 months.
Adjusted for inflation, this metric rose +7.9% MoM and +47.4% YoY.
Real margin debt has now grown +550% since 1997, far outpacing the S&P 500’s real gain of +357.7% over the same period.
Market leverage continues to rise at a historic rate.
This is absolutely incredible.
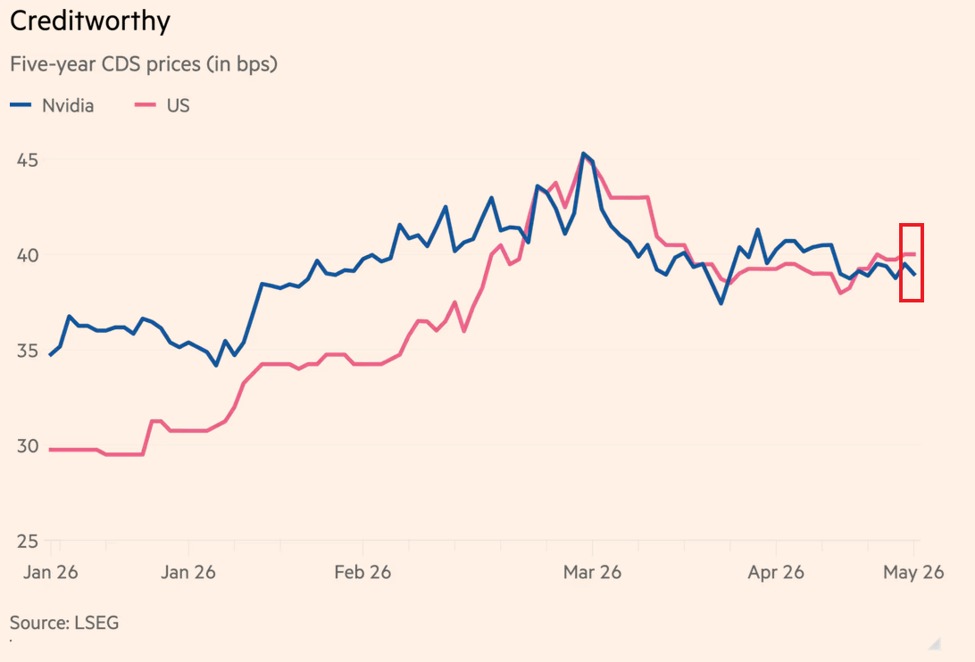
Investors now perceive Nvidia to be as creditworthy as the US government.
Nvidia's $NVDA, 5-year credit default swap (CDS) is trading at ~38 basis points, slightly below the US sovereign CDS, at 40 basis points.
In other words, markets consider the world's largest company to be less likely to default on its obligations than the US federal government.
This comes as in FY2026, Nvidia carried only ~$8.5 billion in total debt against ~$10.6 billion in cash and generated nearly $100 billion in free cash flow, giving it one of the strongest balance sheets of any company in the world.
Even if Nvidia's earnings dropped -90%, it would still rank among the 100 most profitable companies in the world.
Markets are treating Nvidia as one of the safest companies on the planet.
Elemosine di Stato. In Italia nel 2026 esistono il bonus nido, il bonus nuovi nati, il bonus mamme lavoratrici, il bonus mobili, il bonus psicologo, il bonus bollette, il bonus TARI, la carta Dedicata a Te, il bonus ristrutturazioni, l’ecobonus, il sismabonus, il bonus cultura giovani, il bonus libri scolastici e l’assegno di inclusione, tra gli altri...
Ognuno con la sua soglia ISEE, la sua domanda, il suo portale, la sua scadenza.
Il meccanismo è sempre lo stesso. Ti prendono cento con le tasse. Ne fanno passare una parte attraverso ministeri, INPS, portali, DSU, soglie ISEE, bandi e scadenze. E te ne restituiscono venti — se hai fatto domanda, se rientri nei parametri, se il portale funziona.
Nessuno si ferma a fare la domanda ovvia: se quei venti erano tuoi dall’inizio, perché non lasciarli in busta paga?
Perché tassare meno non produce conferenze stampa. Non ha il nome di un ministro. Non genera titoli. Non crea la macchina di uffici, portali e consulenti che serve a redistribuire quello che bastava non prendere.
Il bonus non è un aiuto. È un giro. E il giro costa più di quello che restituisce.
Diceva Frédéric Bastiat: “Lo Stato è quella finzione in cui tutti cercano di vivere alle spalle di tutti”.
(G.A.)
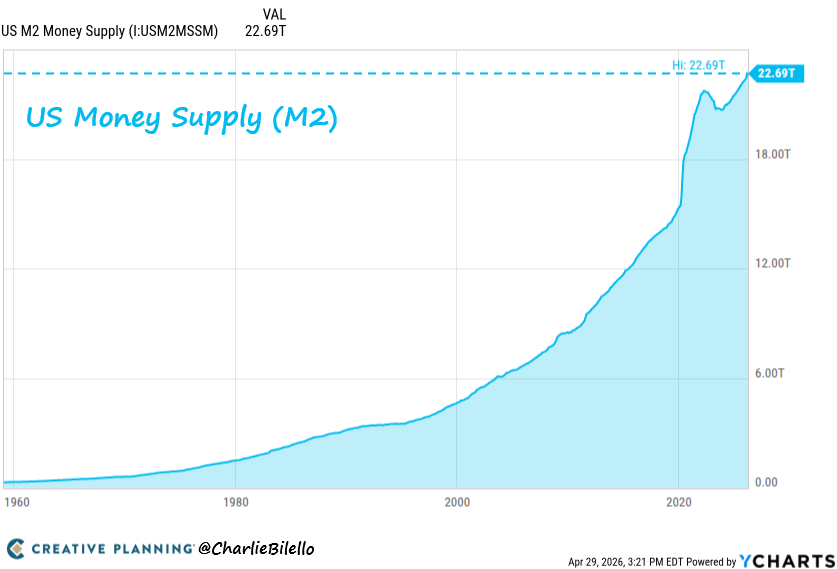
Money supply is skyrocketing:
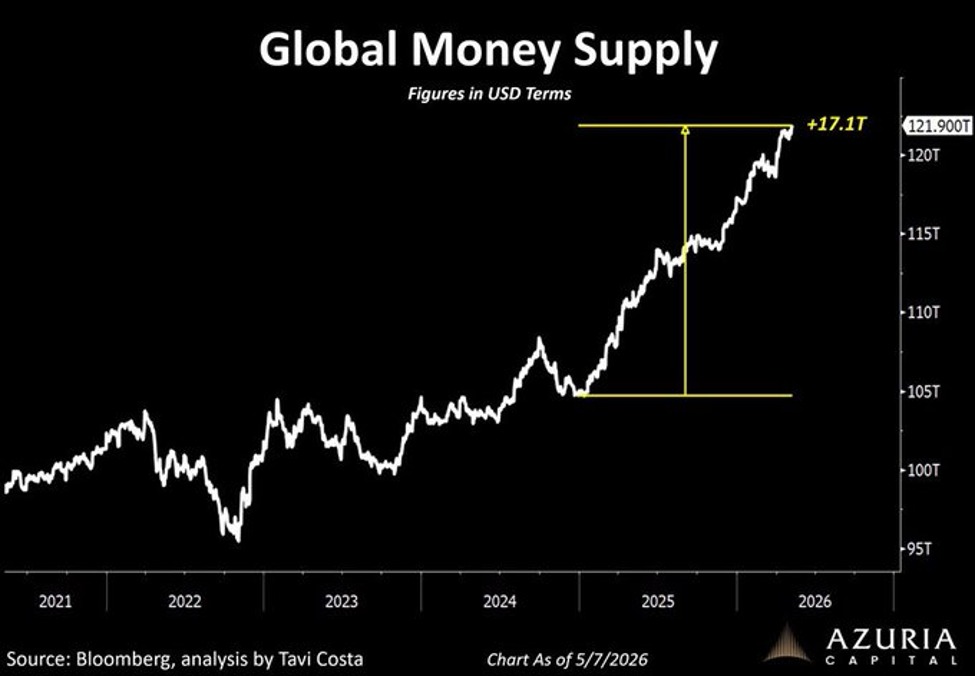
Global money supply is now up to a record $121.9 trillion.
Over the last 2 years, money supply has soared +$17.1 trillion, or +16%.
This also marks a +$27 trillion increase, or +28%, since the 2022 low.
This means that global money supply is surging +7% to +8% a year.
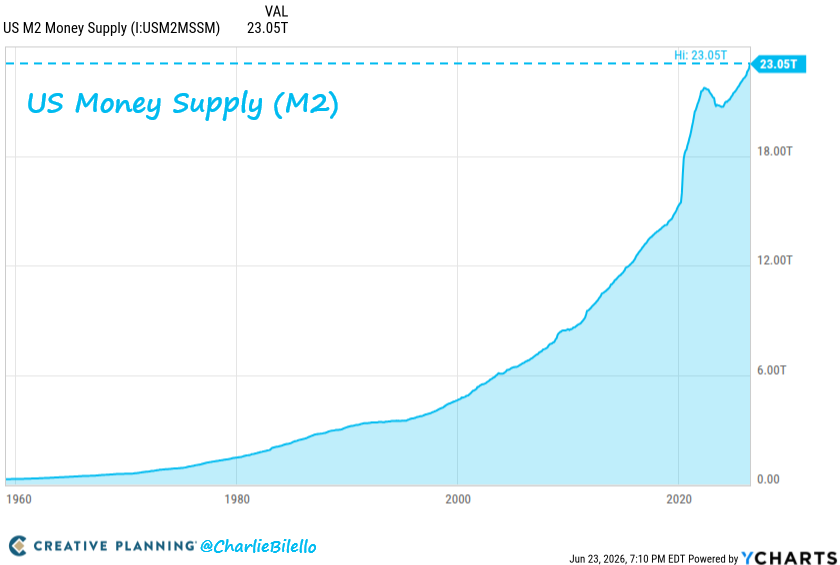
Meanwhile, US M2 money supply jumped +$1 trillion YoY, or +4.6%, to a record $22.7 trillion.
Money supply growth is accelerating.
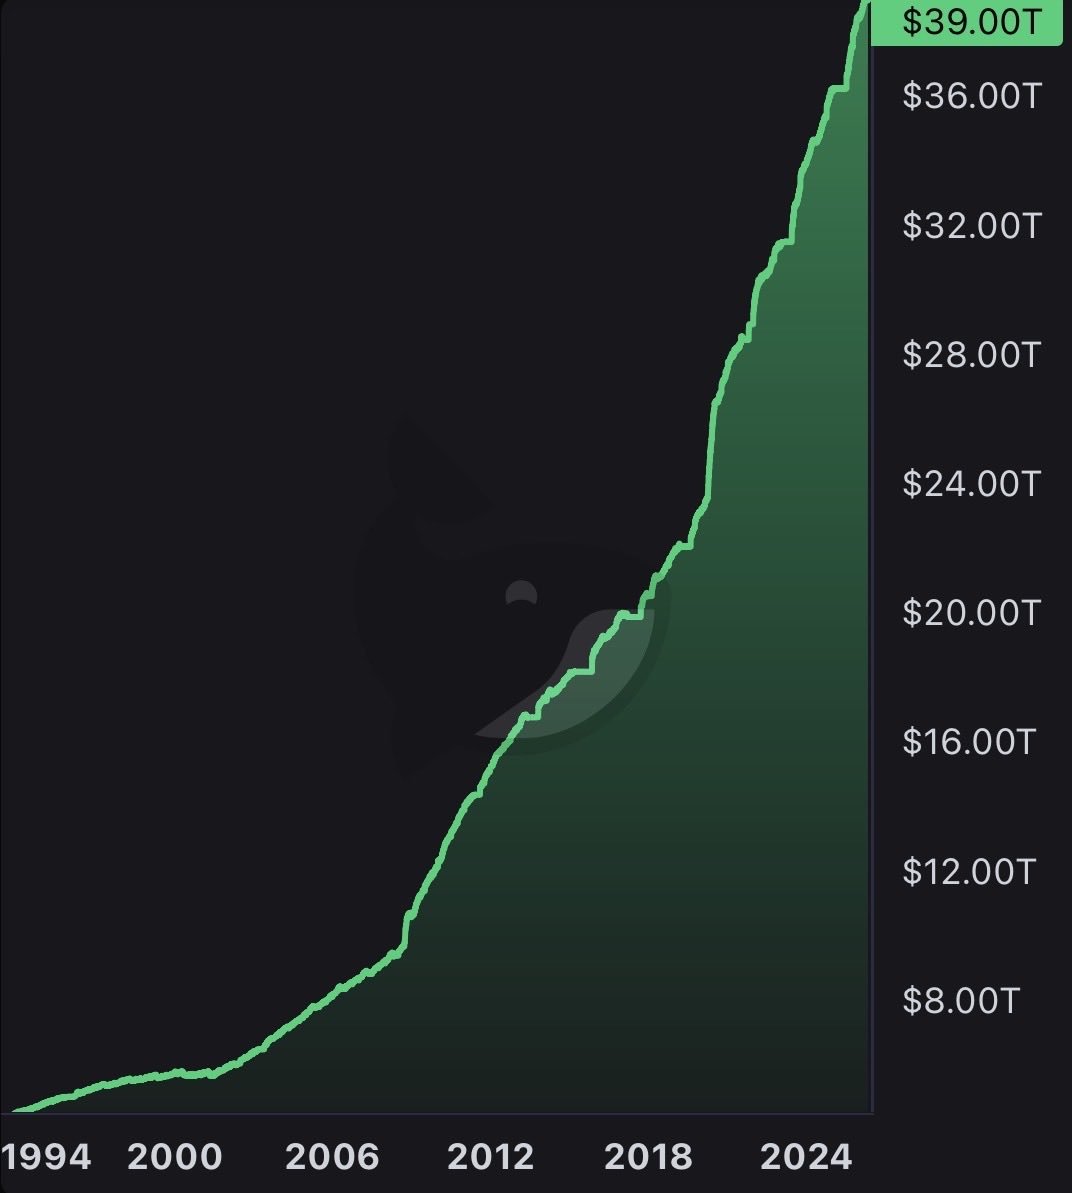
🇺🇸 Here's what $39 trillion in debt really means:
If we confiscated every dollar of U.S. corporate profit ($3.8T/year), it would take over 10 years to pay off.
Sell every ounce of gold ever mined: $32 trillion. Still $7 trillion short.
Liquidate every Bitcoin in existence on top of that: $33.5 trillion. Still $5.5 trillion short.
If we confiscated every dollar of federal tax revenue ($5.3T/year), it would take over 7 years to pay off, assuming zero spending.
The debt is 71% of every home in America, or 30% of every publicly traded company on Earth.
The debt grows by $7.2 billion a day, or $84,000 a second.
This is a problem.
The Fed expanded the money supply by nearly $9 trillion under Powell.
Inflation has averaged >4% per year over the past 6 years.
Powell's explanation? It was nearly all due to rolling “supply shocks" over which the Fed has no control.
The truth: this inflation was made in Washington as it always is - from too much government borrowing/spending and too much government creation of money.
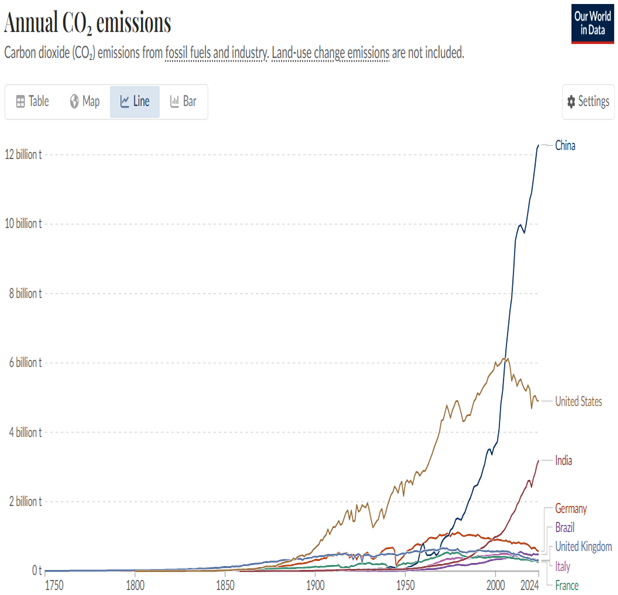
La Cina ora emette più CO2 dell’intero mondo sviluppato messo insieme. Pensa che ti fanno credere ancora che se compri un'auto elettrica e una pompa di calore, il tuo sacrificio salverà il Pianeta!
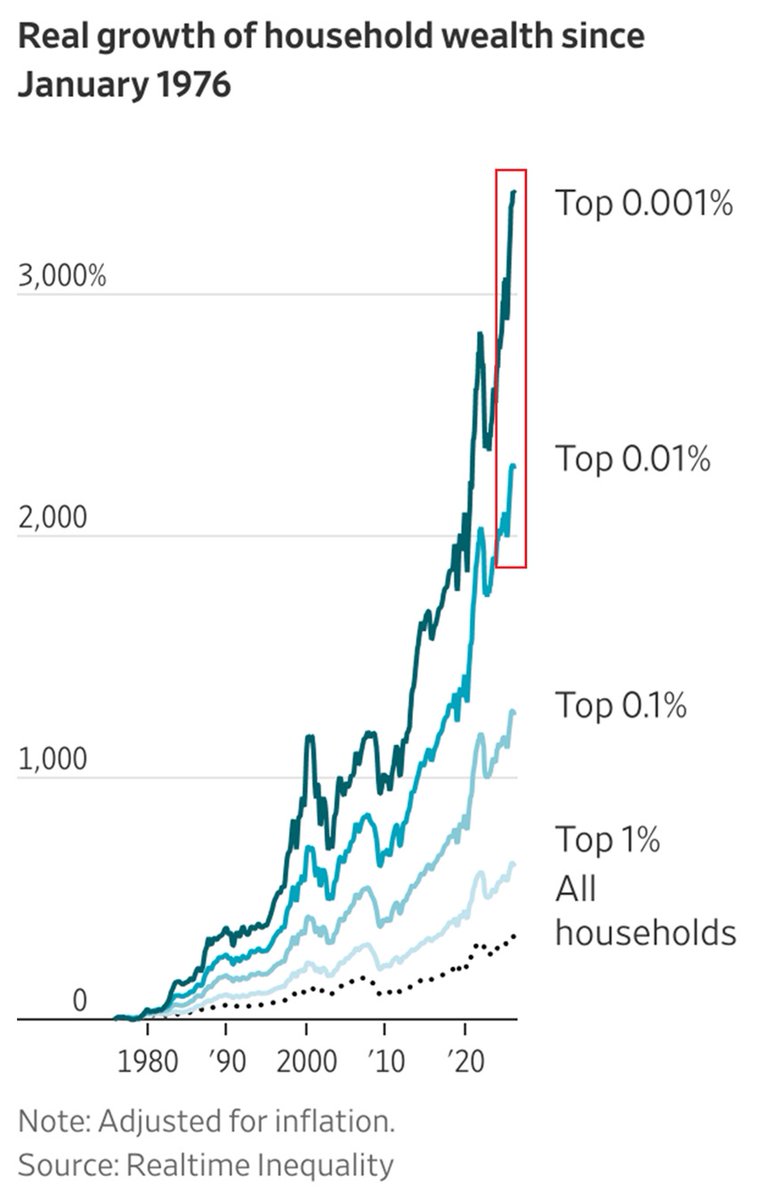
Wealth inequality in the US has never been wider:
The real wealth of the top 0.001% of US households has grown +3,500% since 1976.
At the same time, inflation-adjusted wealth of the top 0.01% and 0.1% has surged +2,200% and +1,200%, respectively.
By comparison, the average household has seen just a +200% increase.
As a result, there are now ~430,000 households worth $30 million or more, with ~74,000 worth over $100 million.
Meanwhile, ~72% of wealth for the top 0.1% is concentrated in corporate equities, mutual funds, and private businesses.
To put this into perspective, the bottom 50% of US households had more debt than assets for nearly 2 decades, with their average wealth turning positive after the 2020 pandemic, following stimulus checks and growing home values.
Asset owners are the only winners.