#NEAR Market Outlook — Balancing Momentum and Caution
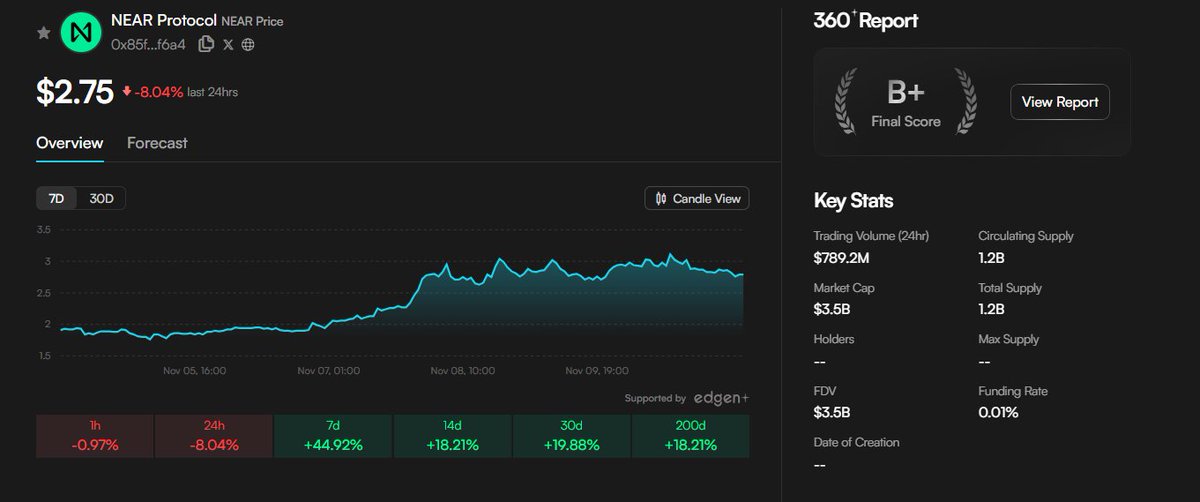
#NEAR Protocol has surged +44.9% in the past week, fueled by the ongoing AI narrative and ecosystem upgrades like Nightshade 2.0 and reduced token inflation. However, the latest -8% daily correction suggests the rally may be entering a cooling phase, with momentum beginning to fade.
On the technical front, #NEAR remains above its 10-day #EMA ($2.52), indicating the uptrend structure is intact. The RSI has moderated from an overbought 68.3 to 60.1, signaling a slowdown in buying pressure. Meanwhile, MACD still prints a bullish cross, though the histogram’s decline hints at weakening acceleration.@EdgenTech
In derivatives markets, a contrasting picture emerges. The Long/Short ratio of 2.27 shows retail traders heavily tilted toward longs — often a contrarian signal of potential downside. Open interest has dropped from $73B to $68.9B, suggesting the recent price rise was driven by short-covering rather than new institutional inflows. The funding rate remains slightly positive (+0.009%), showing mild optimism but also signaling over-leveraged long exposure.@useTria
Key levels to watch:
Resistance: $3.10 and $3.42 — strong sell zones that have repeatedly rejected price attempts.
Support: $2.53 — the first critical area to hold for maintaining the uptrend; losing it may open the path toward $2.28.
Pivot: $2.80 — broken support now acting as near-term resistance.
From a market structure standpoint, NEAR faces a fragile setup. Technicals remain bullish overall, but the divergence between retail “Extreme Greed” and whale “Extreme Fear” is a classic sign of distribution risk. Liquidity thinning on exchanges amplifies potential volatility, especially if long positions start to unwind.@MindoAI
Trading Scenarios:
Bullish: If $2.53 holds, #NEAR could consolidate and retest $3.10. Sustained momentum might later aim for $4.10 in early 2025.
Bearish: Failure to defend $2.53 could trigger a correction to $2.28, potentially deeper if sentiment shifts sharply.@cookiedotfun
In conclusion, #NEAR remains a strong AI-aligned layer-1 narrative but faces short-term exhaustion after a euphoric run. A cautious accumulation zone lies between $2.28–$2.41, with a favorable long-term reward-to-risk ratio if market conviction returns.@brevis_zk
#CryptoAnalysis #Altcoins #DeFi #OnChain #UseTria #EdgeN #MindoAI #CookieDotFun #Brevis
#Aerodrome Finance — The Liquidity Engine of Base
The leading AMM powering liquidity and governance on Base.
TL;DR
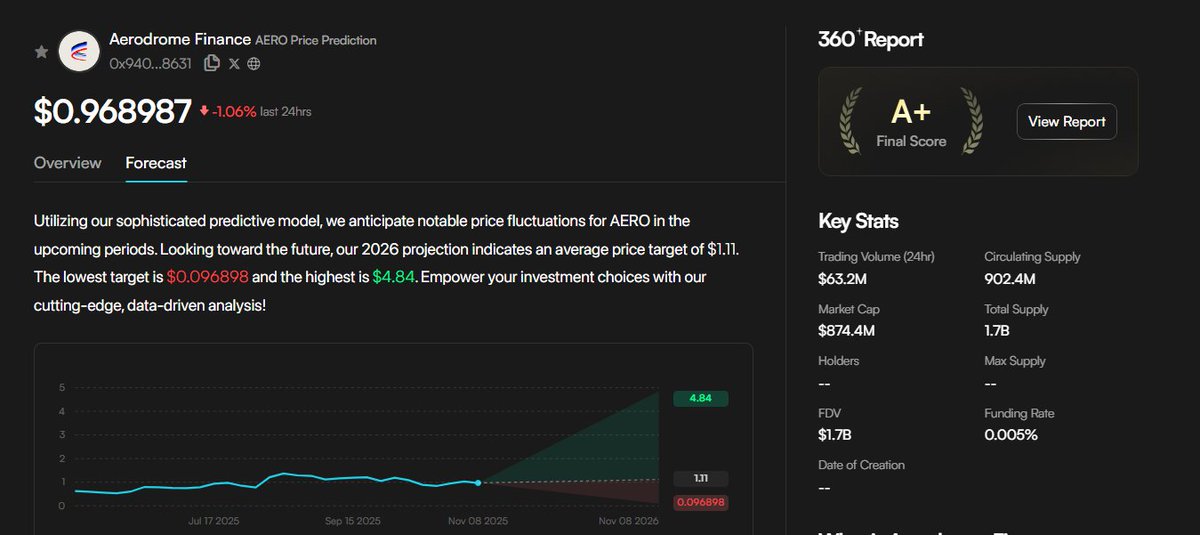
Aerodrome Finance has rapidly become the core DEX on the Base ecosystem, capturing 35–50% of total TVL and handling over half of Base’s DEX volume. Built by the Velodrome team, it merges the ve(3,3) tokenomics model with a revenue-sharing flywheel, returning 100% of trading and bribe fees to #veAERO holders.@EdgenTech
Core Mechanism:
Aerodrome operates on the ve(3,3) model — a hybrid between Curve’s vote-escrow and OlympusDAO’s game theory. Users lock AERO to mint veAERO NFTs, gaining governance power, trading fees, bribes, and fresh AERO emissions. Liquidity pools include:
vAMM: for volatile pairs (Uniswap v2 model)@useTria
sAMM: for stable assets (Curve model)
clAMM (Slipstream): concentrated liquidity like Uniswap v3
Team & Backing:
Created by the Velodrome founders — Alex Cutler, Tao Watts, and Ace — Aerodrome inherits a proven model of execution. Supported by Base Ecosystem Fund (Coinbase Ventures) and Animoca Brands, it has both institutional credibility and community alignment. Notably, Animoca has max-locked AERO to participate in long-term governance.@MindoAI
Market Position:
Aerodrome is a high-beta bet on Base’s growth, acting as its liquidity backbone. It demonstrates capital efficiency superior to Uniswap — generating nearly 2× more trading volume with half the TVL. The ve(3,3) flywheel strengthens its moat: deeper liquidity → higher volume → more fees → more veAERO demand → reduced supply → higher price → deeper liquidity.@cookiedotfun
On-Chain Metrics:
TVL: $540M–$650M (peaked >$1B)
DAU: 40k–60k (peaked 90k)
Revenue: ~$210M annualized
These metrics confirm Aerodrome as Base’s liquidity hub.@SentientAGI
Risks:
Token inflation from continuous emissions
Dependence on Base’s long-term success
Competitive pressure from Uniswap v4
Valuation & Outlook:
With a market cap of ~$942M and P/S ≈ 4.5, Aerodrome is reasonably valued for a high-growth DEX. If Base continues to expand, Aerodrome’s flywheel model could position it as the dominant liquidity layer across Coinbase’s L2 ecosystem.@brevis_zk
#Aerodrome #Base #DeFi #AMM #ve33 #AERO #Velodrome #Animoca #Coinbase #DeFiResearch #UseTria #EdgeN #CookieDotFun
#BTC Market Outlook — Deep Dive (Nov 2025)
Price: $101,813 | 24h Change: -1.21% | 7D: -7.39% | 30D: -16.42%
24h Volume: $49.9B | Range: $101.6K – $103.3K
Bitcoin continues its multi-timeframe correction phase, with strong bearish momentum across daily, 4H, and hourly charts. The loss of the daily pivot near $102,100 confirms sellers’ dominance, while #ETF outflows and weakening structure suggest further downside risk.@EdgenTech
Technical Outlook:
All major indicators align bearishly. #BTC trades below its 10-day EMA ($105.2K) and mid-Bollinger Band ($108.4K). RSI sits at 37.6, near oversold territory, hinting at a possible short-term bounce — yet the main trend remains downward.
#MACD stays deeply negative, though its histogram shows early signs of slowing bearish momentum.@MindoAI
Key Levels:
Resistance: R1 $102.36K | R2 $102.76K
Support: S1 $101.71K | S2 $101.45K
Losing S1 could accelerate a breakdown toward the psychological $100K zone.
Derivatives & Market Structure:
Perpetual funding rates turned slightly negative (-0.00033%), while Binance’s global long/short ratio surged to 2.6, signaling overleveraged retail longs — a classic contrarian sell setup. Open interest slipped from $70B to $68.3B, showing deleveraging pressure.
Notably, U.S. spot Bitcoin ETFs recorded $558M net outflows, removing institutional bid support and reinforcing short-term weakness.@useTria
Macro Take:
Despite fear dominating the sentiment index (23 — “Extreme Fear”), long-term whales quietly accumulated over 29,000 BTC last week — a potential foundation for a later rebound.@cookiedotfun
Trading Bias:
Short-term: Sell rallies below pivot ($102.1K), targeting $100.5K.
Mid-term: Short rejection near R1 ($102.36K), target $95K.
Long-term: Accumulate between $92K–$100K for multi-month positioning.
Bottom Line:
The dominant trend is still bearish, with #ETF outflows, retail overexposure, and failed pivots pointing to lower levels. However, oversold metrics could spark a temporary relief rally — a classic setup before a deeper retest of $100K.@SentientAGI
#BTC #CryptoMarket #BitcoinAnalysis #OnChainData #ETFFlows #Macro #DeFi #Edgen #UseTria #MindoAI #CookieDotFun #Brevis
#Solana — Institutional Wave Meets Market Volatility
#Solana (SOL) faces short-term downside amid broad deleveraging and macro pressure, yet its long-term fundamentals remain resilient. The launch of U.S. spot ETFs has institutionalized demand, while Firedancer adoption is rapidly reducing systemic risk.
Market Overview
#SOL trades at $158.77, down 15.3% weekly and 28.2% monthly, with a $87.6B market cap and $3.4B daily volume. Despite short-term volatility, Solana maintains a dominant position in DeFi and DePIN activity.
Key Catalysts @EdgenTech
Institutional Demand: The successful launch of Solana spot ETFs in the U.S. marks a structural demand shift. The Bitwise Solana Staking ETF (BSOL) drew $129M in two days.
Firedancer Rollout: Adoption surged to 21% of network stake (from 7% in June), mitigating single-client concentration risk and strengthening reliability.@useTria
Macro Pressure: Tightening global liquidity and risk-off sentiment triggered a market-wide selloff, pushing SOL near the $150 support zone.
Growth Drivers
ETF-Driven Legitimacy: Institutional adoption confirms Solana’s position as a core investable digital asset.@MindoAI
Network Resilience: Over 21 months of uptime and Firedancer integration enhance performance and decentralization.
On-Chain Strength: Solana leads DEX volume (81%) and DePIN activity, fueling sustained value capture for SOL.
Alpenglow Upgrade (Q1 2026): Expected to improve throughput and efficiency, setting the stage for revaluation.@cookiedotfun
Risks
Macro Fragility: As a high-beta asset, SOL remains sensitive to liquidity shocks and global deleveraging.
Derivative Volatility: Over-leveraged futures markets increase liquidation risk.
Supply Overhang: Ongoing token unlocks from FTX estate continue to pressure price.
Price Scenarios
Bullish: Holding $150-$156 → breakout above $175 → targets $285-$290.
Bearish: Breakdown below $150 → macro risk-off → retest $126 or lower.
Base Case: Range-bound $150–$182 while ETF inflows stabilize.
Bottom Line
Solana stands at a pivotal point where institutional legitimacy and technical strength intersect. With ETFs igniting structured demand and Firedancer solving key reliability concerns, the ecosystem’s fundamentals are solid. Yet macro volatility and supply risks persist. The next major revaluation likely hinges on the Alpenglow upgrade and sustained ETF inflows — marking Solana as both a test of resilience and a long-term asymmetric opportunity.@brevis_zk
#BTC #CryptoMarket #BitcoinAnalysis #OnChainData #ETFFlows #Macro #DeFi #Edgen #UseTria #MindoAI #CookieDotFun #Brevis
#APT — Market Overview
(Update: Nov 5, 2025)
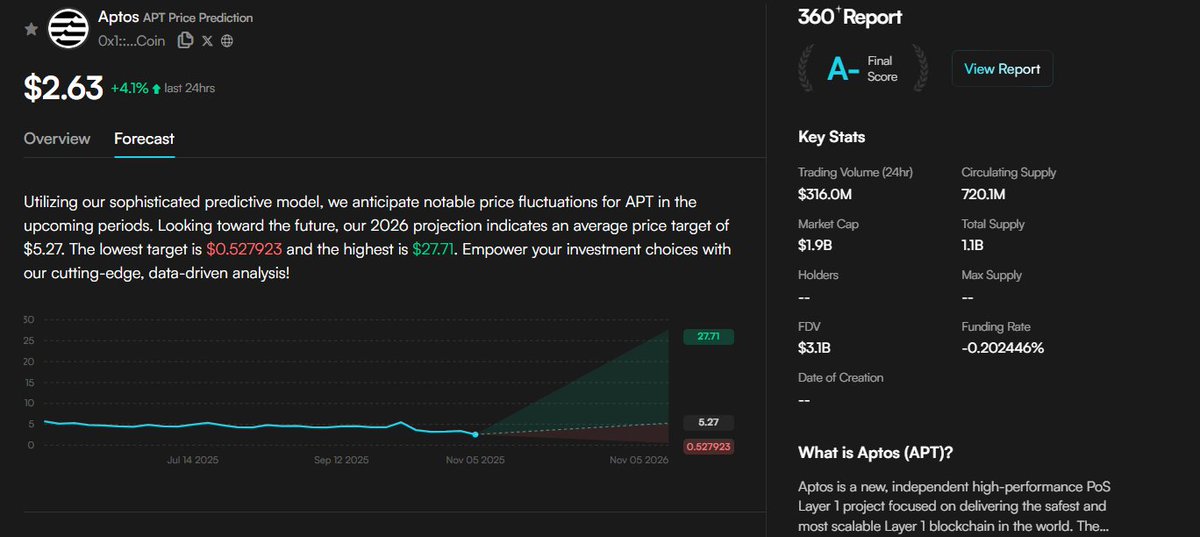
Price: $2.66
Change: 1H: -0.69% | 24H: +5.34% | 7D: -23.24% | 30D: -49.86%
24h Volume: $328.96M
#APT is currently in a clear downtrend, with price breaking through multiple key support levels. While on-chain data signals long-term accumulation from major holders, both technical and derivatives indicators remain firmly bearish.@EdgenTech
Technical Analysis:
#EMA10: Price at $2.66 trades well below $3.04 → confirming strong downside momentum.
#RSI (14): 31.4, approaching the oversold zone → possible short-term rebound ahead.
#MACD: Bearish crossover with negative histogram → downward momentum strengthening.@useTria
Derivatives Market:
Funding Rate: -0.202% → shorts dominating perpetual markets.
Long/Short Ratio: 1.66, down from 2.48 → retail traders exiting long positions.
Open Interest: Declined from $74.7B to $69.06B → capital outflows and weakening confidence.@cookiedotfun
Key Levels:
Resistance: $3.20 / $3.70
Support: $2.71 (broken) / $2.56 (strong psychological level)
Market Structure & Liquidity:
On-chain data shows declining exchange balances, meaning #APT is being moved off CEXs into private wallets or staking contracts — a classic long-term accumulation signal, contrasting with the current short-term selling pressure.@MindoAI
Summary:
#APT remains under significant downward pressure, trading below all key EMAs and the lower Bollinger band. The $2.56 zone will be crucial — if it holds, it could form a strong accumulation base; if it breaks, further downside is likely. Despite the bearish technicals, long-term capital rotation may be quietly building support.@brevis_zk
Trading Plan:
Long-term Accumulation: near $2.56 if support holds
Target: $3.20
Invalidation: daily close below $2.50
Risk/Reward: ~1:10
APT is in a deep shakeout phase, where short-term traders exit while long-term holders accumulate — a pattern often seen before structural recovery.
#APT #Crypto #DeFi #OnChain #Trading #EdgeN #UseTria #MindoAI #CookieDotFun #Brevis
ASTER — Market Overview
(Update: Nov 5, 2025)
Price: $1.06
24h Change: +8.32% | 7D: +0.76% | 30D: -48.7%
24h Volume: $1.25B
ASTER has seen a short-term rebound driven by positive catalysts — including CZ’s investment and the new collateral utility — but the broader structure remains weak, weighed down by long-term token inflation risks and uncertain derivatives sentiment.
Technical Outlook:@EdgenTech
Short-term (1H): Neutral. Price trades between $0.96–$1.10. RSI at 57.9 shows mild intraday momentum, but negative funding rates (–0.002% to –0.005%) suggest derivative traders are cautious. Large traders hold bullish positions (Long/Short 4.05), while retail remains slightly short.
Mid-term (4H): Neutral. The market may be in accumulation mode, supported by new fundamentals but capped at $1.10 resistance. ASTER’s integration as DEX collateral adds real token demand and medium-term strength.@useTria
Long-term (1D): Bearish. Price trades well below EMA20 ($1.13), EMA50 ($1.43), and EMA200 ($1.84). RSI at 39.3 shows weak momentum. Major risk: only 25% of total supply is circulating — implying heavy future unlock pressure.
Key Levels:
Resistance: $1.10 / $1.43
Support: $0.96 / $0.90
Market Structure:
Despite positive ecosystem updates, heavy selling pressure from inflationary supply and weak technical structure persist. Spot inflows remain modest, while leveraged long positions continue to face liquidation — indicating fragile upside confidence.@cookiedotfun
Bullish Factors:
CZ’s strategic investment boosts market trust.
New collateral use case creates sustained token demand.
Institutional traders positioning long on derivatives.
Exposure to Perp DEX, one of DeFi’s fastest-growing niches.@MindoAI
Risks:
Price remains under all key EMAs, confirming a bearish macro trend.
High FDV-to-MCap gap (4x) signals long-term dilution.
Ongoing long liquidations reduce confidence in short-term rallies.
Potential concerns over historical on-chain volume integrity.@brevis_zk
Trading Plan:
Short-term: Sell near $1.10 → Target $0.96 → Invalidate > $1.13
Mid-term: Buy on bounce from $0.96 → Target $1.28 → Invalidate < $0.90
Long-term: Accumulate near $0.96 → Target $1.84 → Invalidate if weekly close < $0.084 @openmind_agi
ASTER’s near-term resilience is tied to new utilities and investor sentiment, but the broader trend remains technically bearish until price reclaims above EMA50 ($1.43).@SentientAGI
#ASTER #DeFi #PerpDEX #Crypto #Trading #EdgeN #UseTria #MindoAI #CookieDotFun #Brevis