3) If history repeats, we are in second wave of inflation till end of 2027. Everything is pointing to inflation running higher next 6 Qs on trend basis:
As we say goodbye to Jay Powell we can can without doubt conclude as a fed chair he failed on inflation and ran ultra loose monetary policy which primarily benefited asset holders. Since Mar 2021 CPI has been above 2% while financial conditions been on super easy mode and unemployment rate at secular lows
-Continues expansion in M2 (outside of brief 2022 contraction) has kept inflation elevated. Government deficit was a big driver but Fed did nothing to counter it with tighter monetary policy
-He is now handing to Kevin Warsh over economy that's overheating, M2 in expansion mode (through both deficits and private sector/bank lending to finance Ai boom). Since inflation 5.5Y cycle in up-phase till ~end of 2027 and M2 leads inflation by 18-24 months, there is not much Warsh can do short term to tackle it. If he is serious, he needs to tighten money supply and financial conditions through asset prices/wealth effect which would be a hard thing to do with Trump wanting to run it hot and Wall Street addicted to liquidity with zero pain tolerance to any prolonged volatility
-Warsh being somewhat of a monetarist, I want to give him the benefit of doubt. It's no coincidence dollar bottomed when Warsh nomination was announced. Cont...
For now 2 key cycle lows I’m eyeing are H2 July and late Oct (my primary target for 3.5Y cycle low). Once each one plays out I can assess the structure and longer cycles. Too far to predict with any degree of confidence.
-There are alternative scenarios - eg 3.5Y low happened in Apr 2025 - I would still expect 18M cycle to fall around Q4 2026 in that case (not my primary scenario).
-Another low probability scenario is 3.5Y low would fall into early 2027
-Given cycle variation I have a primarily scenario and focus on shorter term cycles and PA and supporting models, leading indicators, cross asset correlations and cycles; ie confluence.
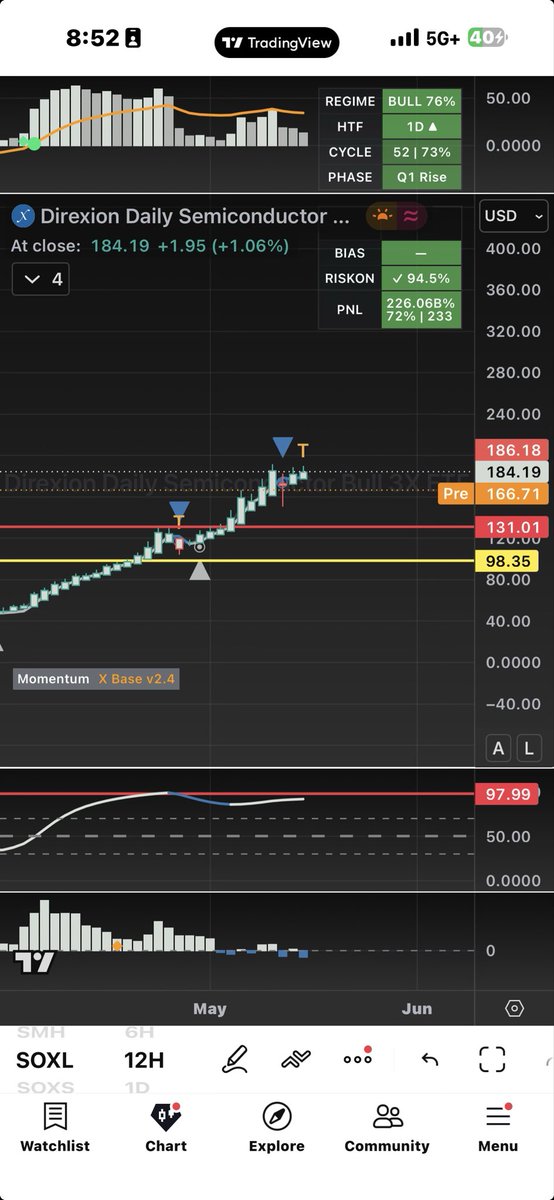
$SOX there are multiple ways you can align charts to get to conclusions that fit your bias. Since my base case is that we are at the very tail end of an extended 4Y cycle, I find alignment of current chart vs last leg up in dotcom cycle pretty clean comp. Similar 1.5 month rally of 80% vs 70% now. Double top structure on daily. I expect down cycle into 4Y low to be shorter / faster than during dotcom. Next few weeks will give us an answer.
$SMH $SOXX
$JPY USD with all the useless BoJ interventions has been following seasonal pattern well last 3 years.
-Fundamental outlook on yen remains negative until oil peaks so expecting 160 level to be broken.
-Bottom panel is 18M cycle which still has time for 1 more push higher in USD next few months.
Silver and Gold are starting to diverge here.
Gold is inversely correlated with oil right now. Countries like India have restricted demand during the energy crisis, and Turkey has been selling gold for economic reasons.
Silver, on the other hand, has 50–60% industrial demand that is getting tight. ex. solar panels.
Do not chase gold here.
Silver looks like it will base a bit longer, possibly test lower levels, then rally alongside the stock market in early June.
More details coming.
Like and retweet if you want the full update on PMs.
PS. Side note on metals - Lithium topped here and is in corrective mode... PGM metals are basing - and the costs for uranium and nickel mining are going up due to shortage of sulfluric acid (restricted by Hormuz SoH).
We may do a metals update soon.
Nat Gas… Think we’re setting a multi-year bottom?
Do the math - it’s possible.
- Qatar + Gulf states: capacity down
- Russia getting hammered by targeted Ukraine strikes
- US glut easing into an El Niño summer
- Recent lows driven by glut + export bottlenecks
- Europe running critically low
- No SPR for gas… so China’s burning Australian coal
- US becoming a true global energy superpower (LNG leading the way)
- New meaningful supply? Harder than it looks
- GEV turbines flipping fast to nat gas for data center power (heavily constrained now)… Uranium next 🔥
What am I missing?
A quick ask here.
Get your friends to follow us - especially to help avoid situations like this (see below).
Some thought we had bottomed on the May 11th, while our Crypto Risk Index on the dashboard was already rising.
We then posted a clear “stay out” signal on May 13th/14th.
There are still many people holding heavy bags from 2025 with no clear exit plan.
A. Get them to use the Kinetic Flow Dashboard
B. An update is coming later this week with a practical approach on how to help these folks “climb out”
These are all classic signs we’re in the final stages of the bottoming process.
We are in a middle of another leg down that will get many more fold and give up. Just when we are not far from the bottom.
Lastly. By the looks of it, we’ll also face energy and food disruptions with cascading effects on the broader market - likely pushing TradFi lower and the final crypto bottom with it into late summer / October (post SoaceX ipo).
if you have friends and folks you know that were affected this way... pls get them to follow us :-) .
Sad really. but it is areality for many folks we meet in crypto. and some are holding bags since 2025... something we could help with as well... soon (updates coming).
https://t.co/m8qUUs46UA
We warned of a pullback on the 28th and went short a bit too early.
Prior to that, we called the bottom at 6350.
The pullback is finally here. We were early (algos will be adjusted). Got a bit full of ourselves after calling the tops in Gold, Silver, Oil, and the market bottom.
(not even referring to last year calls).
We still plan to make money on the shorts, but more importantly, we want to guide you correctly.
You’ll hear plenty of FT gurus screaming end-of-the-world headlines about yields, Japan carry trade, and other nonsense.
This is a pullback, not a crash - late bull market profit taking.
Enjoy the show.
Our system alerted us 10 days in advance. We just didn’t play it optimally, entering 3 days earlier (on the 5th and 6th) than we should have in a euphoria pumped by US admin.
More updates coming.
P.S. $SOXL extended double top (chart below). One of the most telling signs: low/negative volume pressure on the bottom VTM indicator while price ripped higher. Parabolic move with minimal volume support since May 4th.