The 1-sigma envelope on $SPX is public information. Most traders will never realize it exists.
By 9:30AM, implied vol has already repriced every contract on the board before spot moves a single point. A 20.00 call becomes 22.70 with the tape frozen.
They see "price action." A tiny group of vol desks sees a surface: strike x hours to close x gamma exposure.
In 2026, desks price a 71.4 point daily envelope before the bell. The average retail trader buys a 7,740 call 89.5 points away with 6 hours left and calls it "cheap."
Same strike. Same direction. Completely opposite outcome.
Same spot. Same close. Completely different P&L.
The difference isn't the entry. It isn't the stop. It's the three axes your contract lives on: strike distance, hours remaining, implied vol.
Here's the ledger, coordinate by coordinate ->
THE PROBABILITY CONE:
> 7,650.5 spot at VIX 14.81 prices a 1-sigma day of 71.4 points, putting the session inside 7,579.1 to 7,721.9. That's not a forecast. That's arithmetic.
> 68% inside the cone leaves 16% per tail, so anything bought outside 7,721.9 is a bet on the thin side. That isn't a setup. That's a coupon.
> 11:00AM has already burned over half the envelope because time decays on square root, not straight line. The cone doesn't open evenly. It opens fast then stalls.
> 7,614.8 and 7,686.2 are the half-sigma shelves where most sessions come to rest. That's not support. That's distribution.
> 159.6 points is the weekly envelope, only 2.24x the daily. Five days isn't five times the move. It's 2.24 times the move.
THE VOL AXIS:
> 14.81 to 16.81 on VIX widens the daily cone from 71.4 to 81.0 points with spot unchanged at 7,650.5. That's not a move. That's a repricing.
> 2.70 of premium appears on a 20.00 ATM 0DTE call from those 2 vol points alone, 135 dollars per contract before price ticks. That's not momentum. That's vega.
> 3:00PM takes the same 2.70 back out even when direction agrees with you. The chart isn't lying. The axis is moving.
> 7,579 puts gain delta as IV rises, pushing dealer hedges toward sales into a flat tape. That isn't selling pressure. That's vanna.
THE MATRIX COORDINATES:
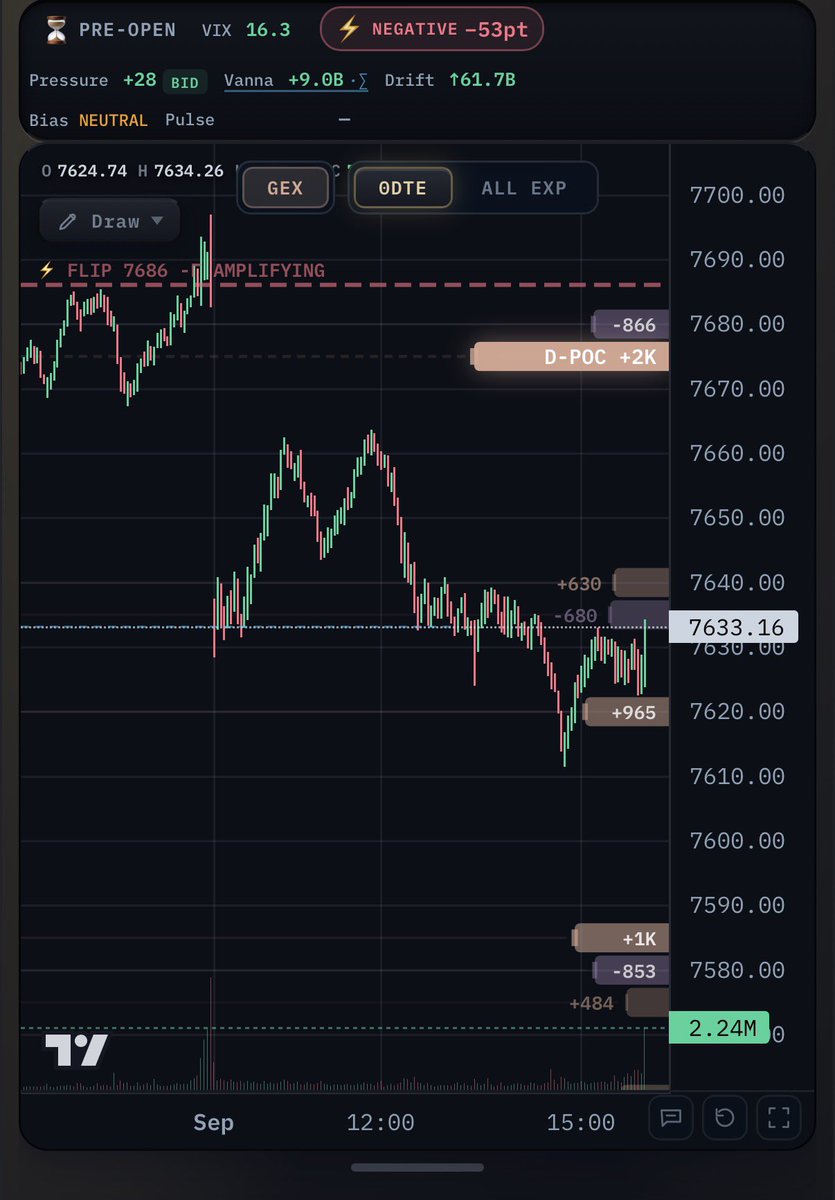
> 7,690 call wall sits 39.5 above spot and 3.8 above the upper shelf, so upside needs a full sigma to clear it. That's not resistance. That's inventory.
> 7,615 put wall lands 0.2 from the lower shelf at 7,614.8, stacking strike gravity on statistical gravity. That isn't coincidence. That's where the book was built.
> 7,614 flip: above it dealers buy dips and sell rips, below it they sell weakness. Positive gamma isn't calm. It's a contract.
> 7,650.5 midline: ES overnight drift of +0.95% already spent 72.7 points. The gap isn't a trend. It's the day's budget, gone.
Now the part retail never computes.
7,650.5 x 14.81 / 100 / 15.87 = 71.4
71.4 x 2.236 = 159.6
7,650.5 x 16.81 / 100 / 15.87 = 81.0
81.0 - 71.4 = 9.6
9 winners x 525 = +4,725
19 losers x 250 = -4,750
> Cone: 7,579.1 to 7,721.9, shelves at 7,614.8 and 7,686.2
> Two vol points buy you 9.6 extra points of envelope with zero price movement
> Net on 28 trades: -25 dollars at a 32.1% hit rate against a 32.2% breakeven
A directional long bought WITH the cone and vol regime accounted for is a priced bet. A directional long bought off a 2D chart is the trap that loses when IV drops, even if price agrees with you.
Most traders will never realize it exists. They'll keep buying 7,740 calls off a flat chart while the surface reprices their contract at 9:31 and again at 3:00PM.
The chart shows you where price was.
The ledger shows you where it must go.
I map these exact Expected Move boundaries before every session.
What is the widest 1-day Expected Move your broker has ever priced on SPX while you were holding?
3 CONFLUENCES LINED UP TO MOVE THIS PRICE 🚀🔥
NQ parked on that POC at 29430
ES + SPX BOTH bouncing off on the orderblock at the LOW OF THE DAY
That’s not random that’s a setup. Smash like if you caught this squeeze #gamma#gexa
Here’s a basic guide to help you start reading the @unusual_whales Gamma Heat Zones and understand what the colors, nodes, expirations, and positioning are actually showing you. Combine this with the video below and it’ll give you a deeper walkthrough of how I actually use the Heat Zones with real examples.
🚨As promised to deliver and make this platform one of the best, Gexa is getting a huge update today:
Three new lenses:
DEALERS: where market makers(CBOE) report their book sits - SPX only
FLOW: what today’s tape is building
STRUCTURED: the standing map, weeks in the making
I mentioned in earlier post how much I like the ATR super trend, but add this free indicator and it could be a cash machine... check this one out. https://t.co/KtFBEGjLk7
Try this $spy 0dte rule in August:
1. follow your levels
2. buy 1-strike OTM
3. hold for 1-15 minutes max
4. rsi < 30 calls • rsi > 70 puts
5. set the bracket order every time
6. take 90% first touch setups only
7. review your trades 3-5x per week
8. be consistent and mad disciplined
9. take 100% responsibility for every loss
Save this.
You're going to make a ton of money over the next 30 days.
The Trading Strategy That Helped Me Get to Full-Time
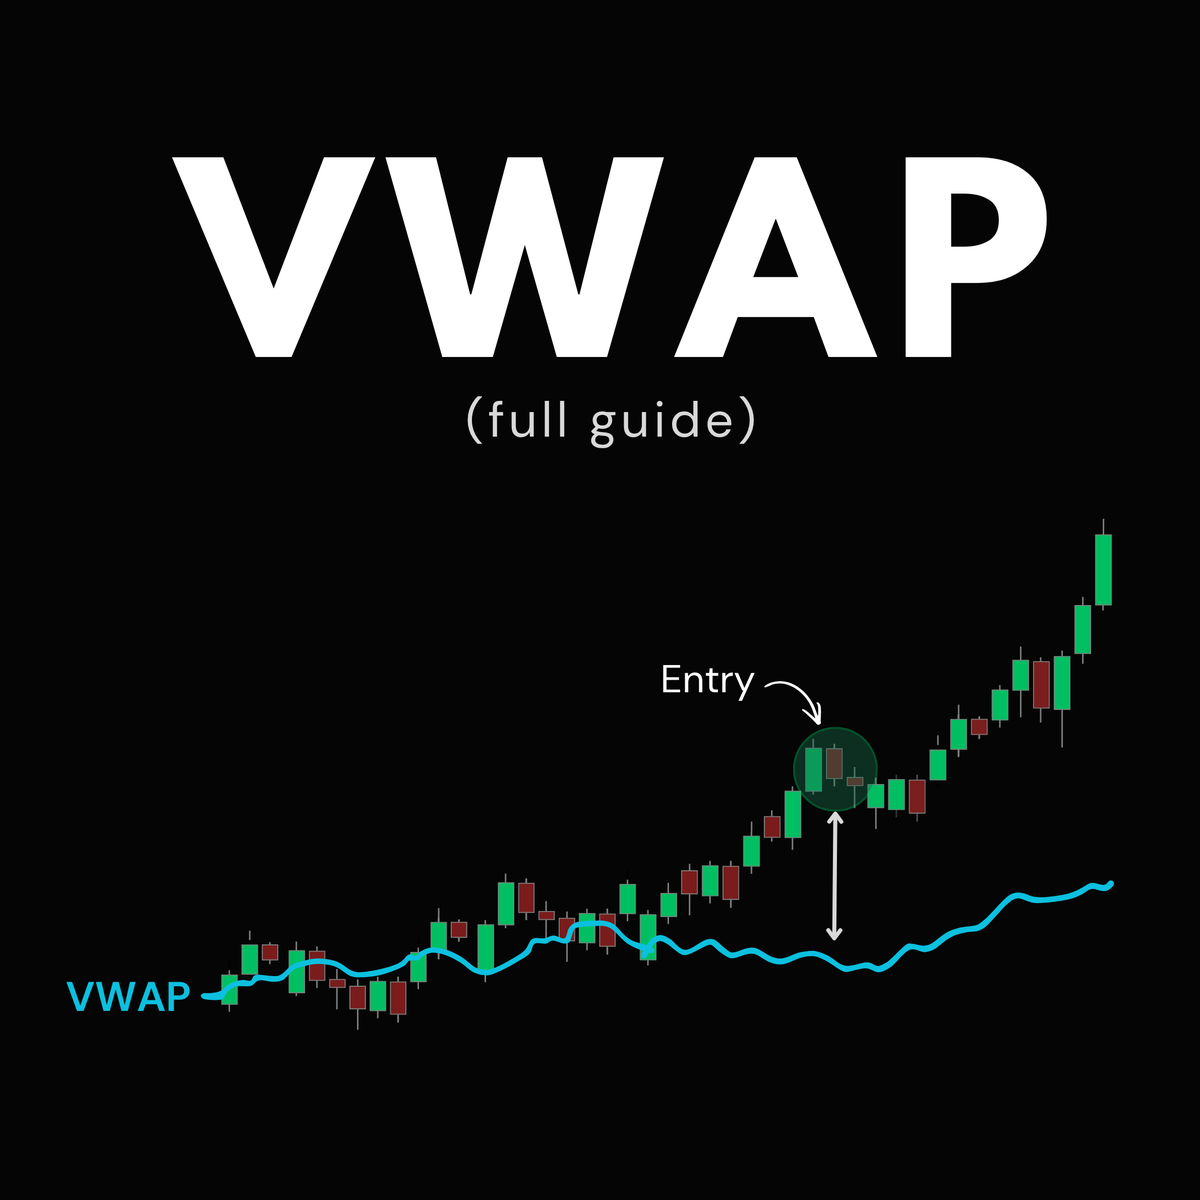
Just using 2EMAs and VWAP.
Red line = VWAP.
Yellow line = 200EMA 1 min.
Blue line = 200EMA 5 min.
Wait until 10ET.
If above all lines look long.
If below all lines look short.
15-20 point stops enter on EMAs or VWAP
Take profit 15-20 points.
I do this everyday.
For more info
@drtipalerts
I used Claude to study 10 years of Opening Range Gaps, then built a @TradingView indicator for it.
It draws the ORG, classifies it, and gives you the live odds of price reaching each level.
Like + Comment "GAP" and I'll DM you the Indicator and the Study.
(Must be following)
THIS SIMPLE STRATEGY WILL MAKE YOU YOUR FIRST $100K
1. Mark the previous day’s High and Low.
2. Wait for a 1-hour candle to break above the High or below the Low.
3. Wait for the retest of that level and enter in the direction of the break.
Read this Before you trade next.
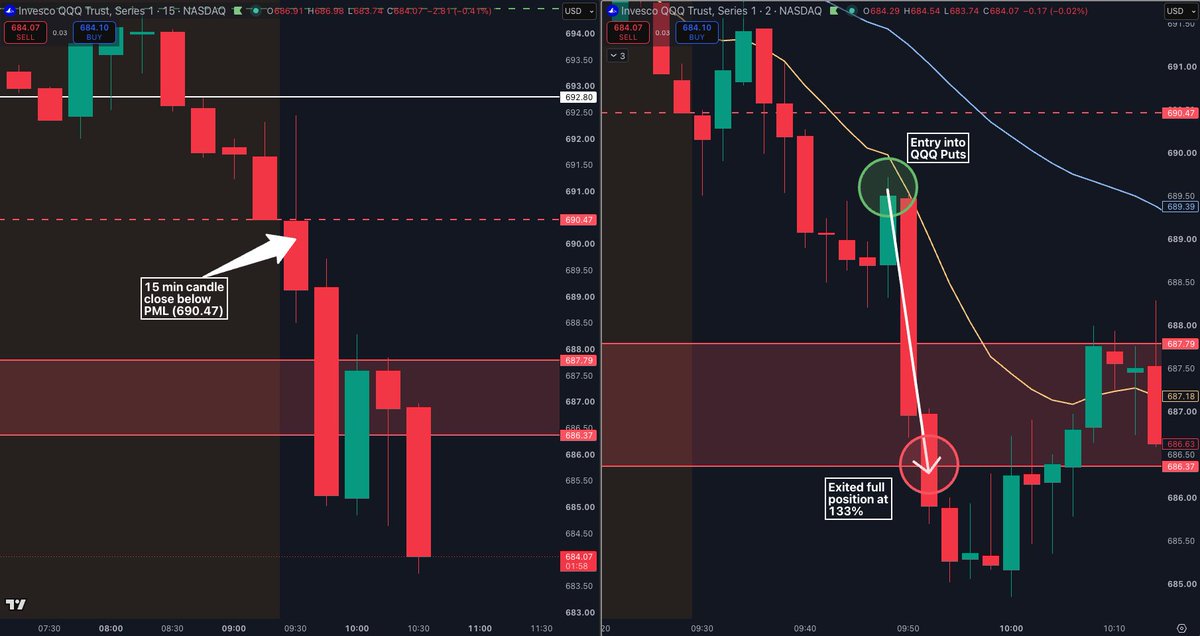
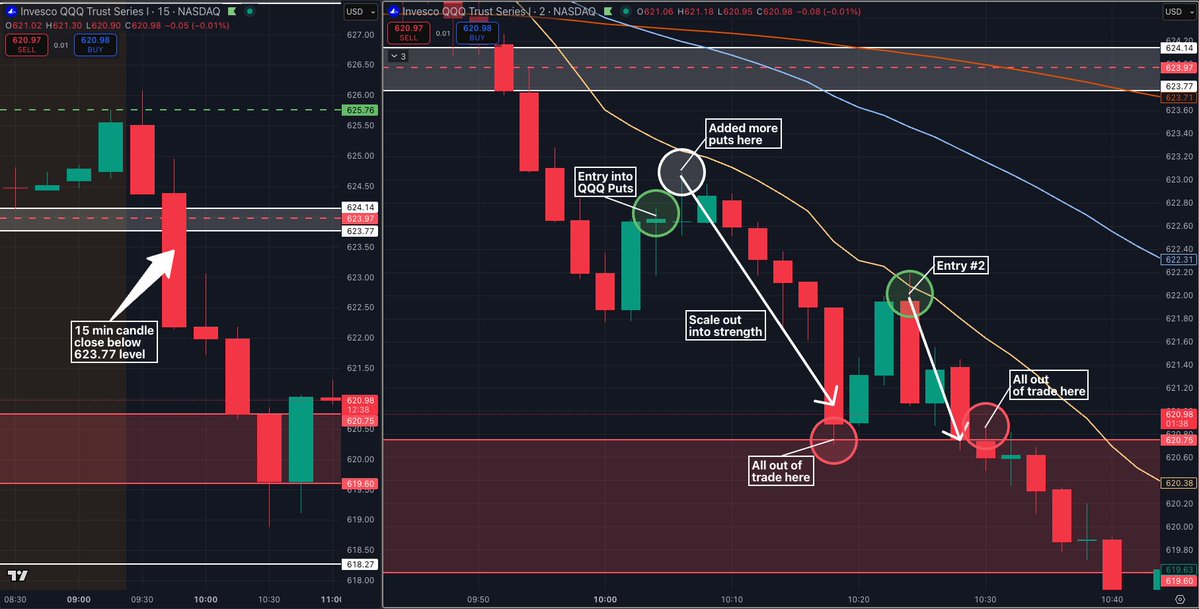
📉 $QQQ Put Recap
Saved the best for last — what a way to close out the week. 🔥
📌 15-min candle close below PML (690.47)
📌 Entry on the 2-min pullback to the 13 EMA
📌 Target: PDL zone
Near perfect entry on the 13 EMA pullback — price flushed straight to the PDL target without looking back. Sold the position right at the target and stepped away. 🚀
✅ +133%
No chasing, no holding for more, no second guessing — just a clean entry, a clean exit, and a stellar finish to the week. 🧠
📊 Perfect entries come from patience — never from rushing
📌 When price hits your target — you take it and walk away
📈 Level to level, zone to zone — the plan always delivers
Stellar week in the books. That's how you level up. 👊
TECHNICAL ANALYSIS MASTERCLASS📚📖
1) How to draw key levels
2) How to determine the strength of a trend
3) How to spot a reversal
4) How to trade a range
Don't be lazy. Get 1% better today
Here's the exact entry trigger I use on every trade. 📊
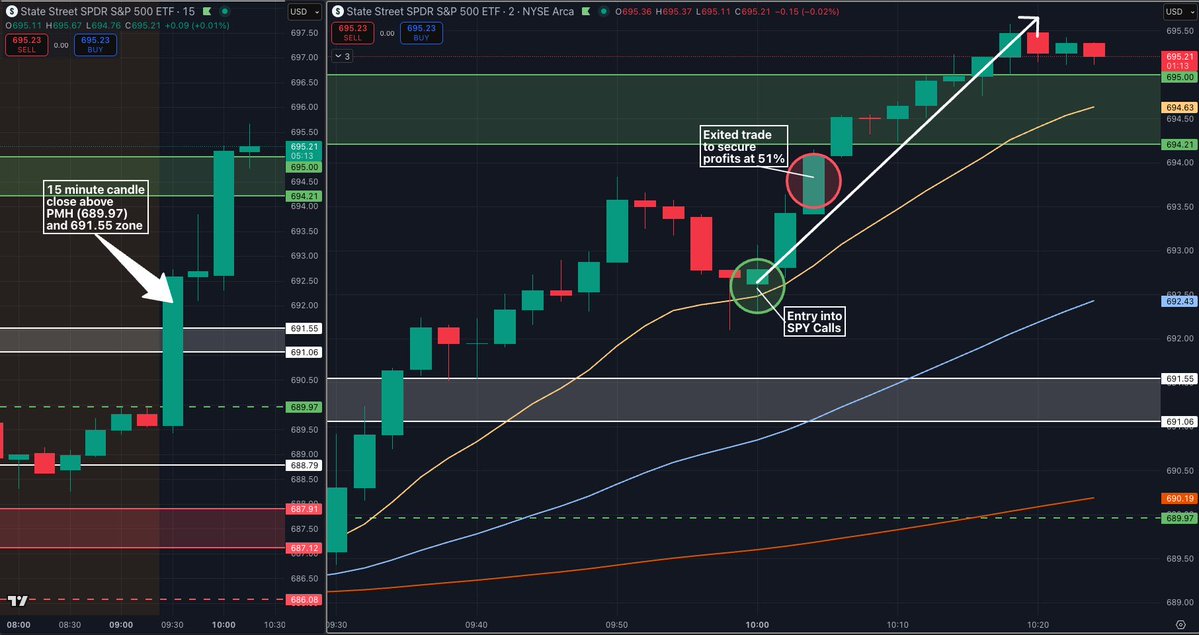
Step 1 — Wait for a 15min candle to close above PDH, PMH or below PDL, PML.
That's the signal. Not a wick. Not a touch. A confirmed CLOSE. 🕯️
Step 2 — Drop to the 2min chart and wait for price to pull back and HOLD.
📈 Calls — pullback and hold ABOVE the level and/or 13 EMA
📉 Puts — pullback and hold BELOW the level and/or 13 EMA
That's your entry. 🎯
Why this works:
⚡️ The 15min close confirms real momentum
⚡️ The pullback and hold proves the level is now acting as support or resistance
⚡️ The 13 EMA gives you a low risk, defined entry point
You're not chasing price. You're waiting for it to come to you.
Patience is the edge. 💪
Learned this rule on the floor 45 years ago and it still holds true 90% of the time (or so it seems): "If a stock does not trade into its GAP area the next 4 days, it can continue in the direction of the gap for 2 weeks. can see how this worked perfecetly the past two months on big blue!
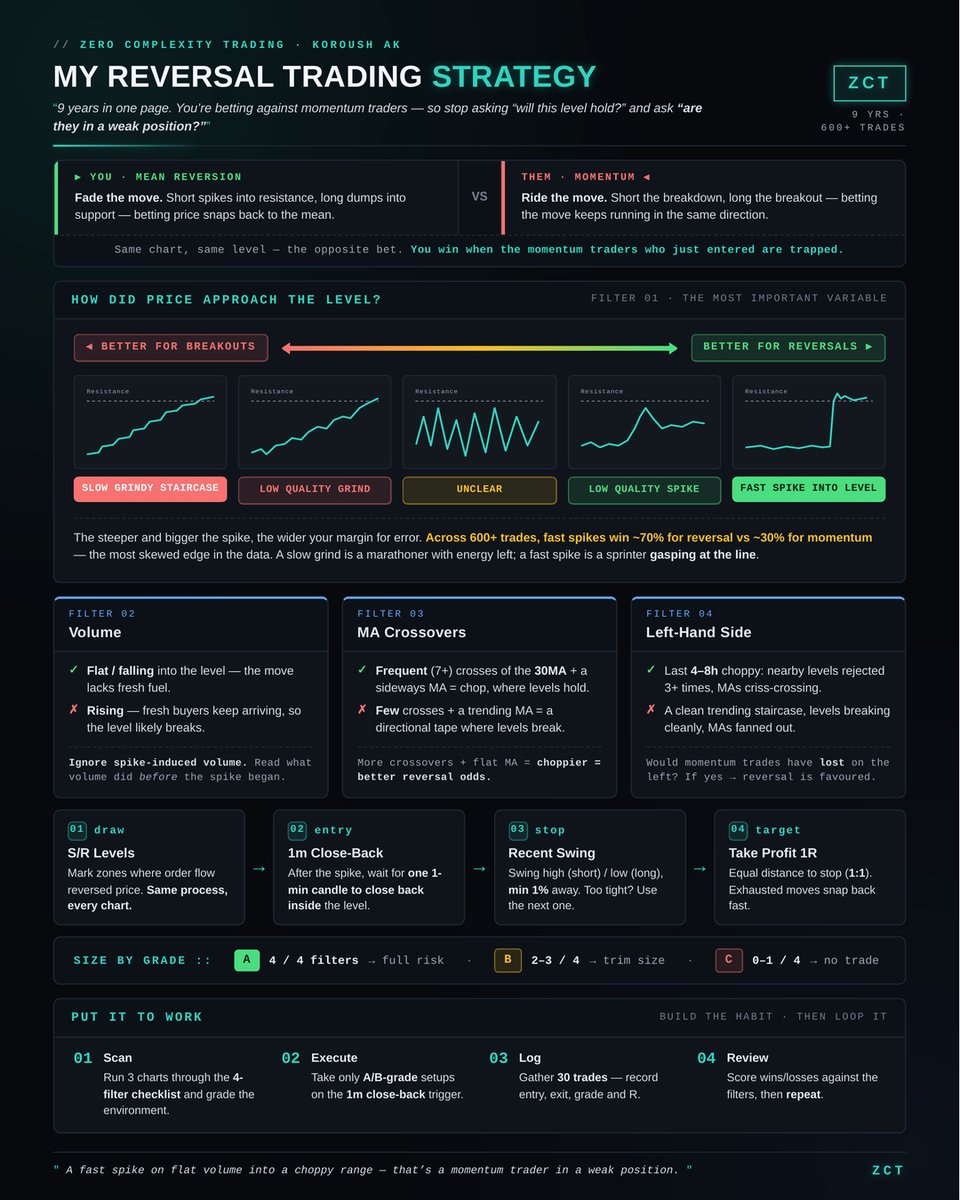
This strategy has caught me more reversals than anything else.
In this guide you'll get:
- Exact entry and exit rules
- Optimal trading environments
+ Real Trade Examples (not just theory)
I also made a full cheatsheet for you to download.
Enjoy.
how i learned to trade $SPY 0DTE with zero experience.
1. googled "how do SPY options work" and went down a rabbit hole for a week.
2. spent 1 month just watching SPY every morning. no trades. learned how price reacts at whole dollar levels.
3. picked one setup:
first touch at a key level.
RSI confirming above 70 or below 30.
that's it.
4. started with 1 contract. $100 deployed. real money, real fills, real emotion. documented every single trade.
5. blew a few setups, broke my own rules, lost money i didn't need to lose.
6. kept showing up at 6:30am anyway.
7. the system started clicking.
now i trade before work every morning, from my phone, and document everything publicly on X — wins and losses.
if i had to start over, i'd do every step exactly the same.
except step 5.
save this